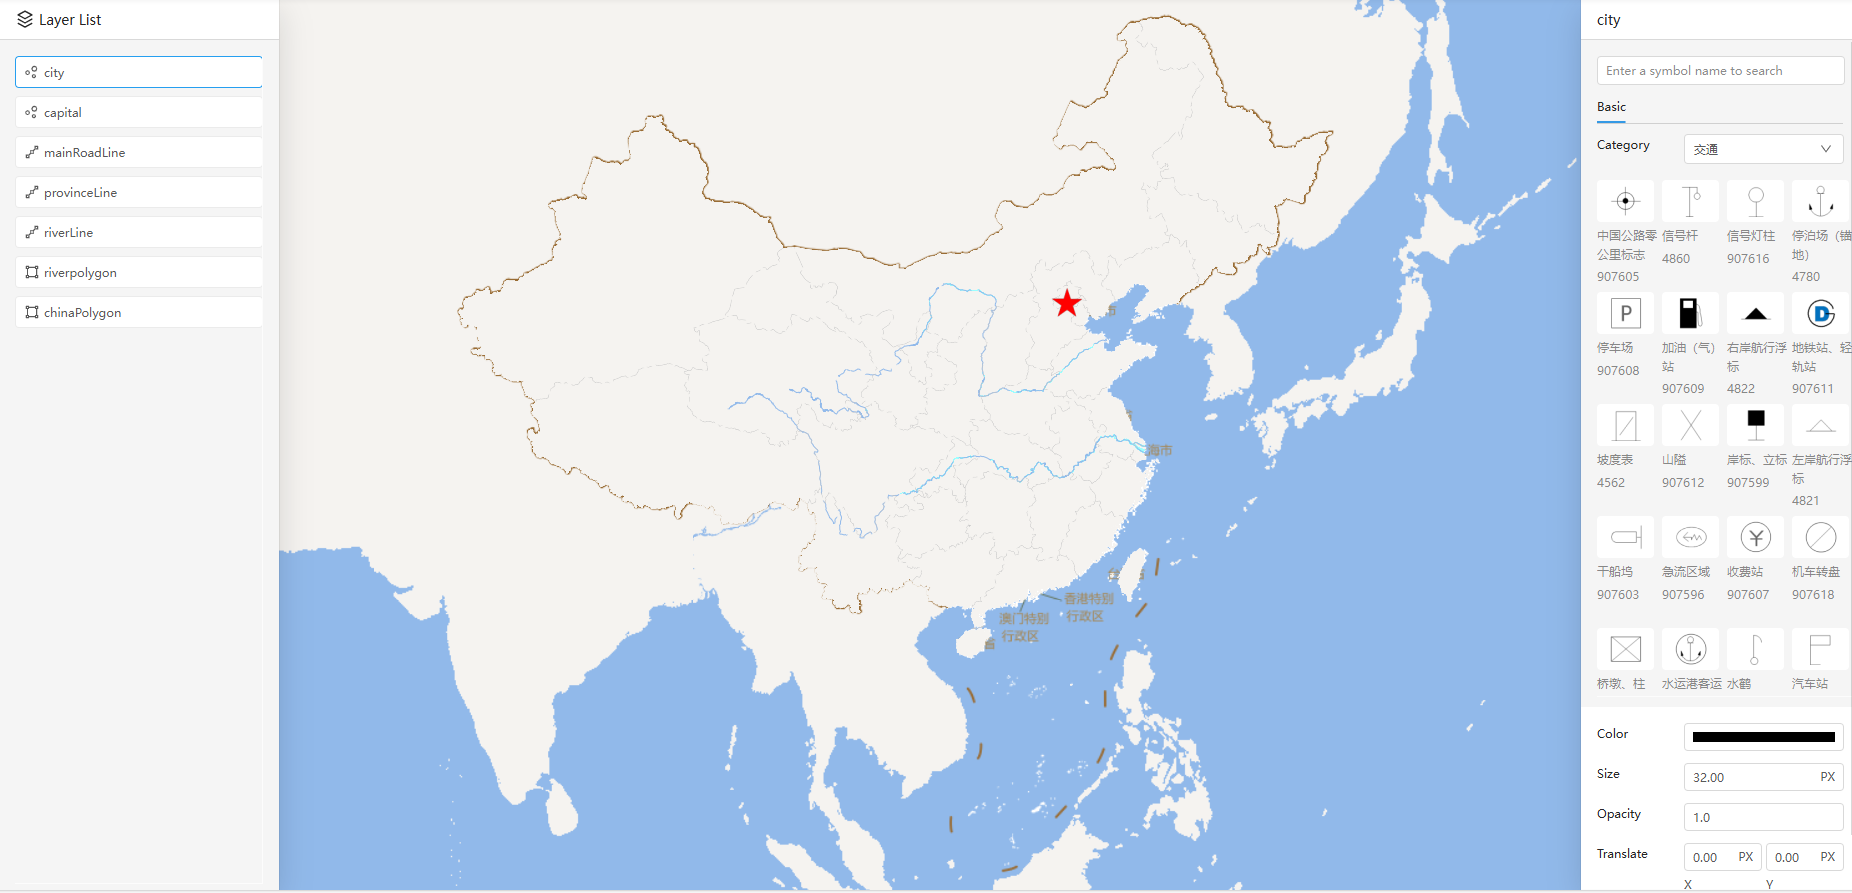
# WebSymbol
# Overview
SuperMap iClient for MapboxGL extends MapboxGL API to support Web symbol gallery, and provides users with the ability of front-end and back-end consistent Web symbolic mapping capability. It also supports to customize Web symbols to meet users' diverse mapping needs.
In order to help you quickly get started with Web symbol mapping in SuperMap iClient (hereinafter: iClient), this article mainly introduces the Web symbol gallery in the following parts:
- Support Details:Support Status: Web symbol gallery's current coverage of symbols in Supermap iDesktop/iDesktopX (hereinafter: iDesktop/iDesktopX).
- Mapping Effects: Comparison of point, line, and fill symbol styles and mapping effects between the Web Symbol gallery and iDesktop/iDesktopX.
- Usage Instructions: How to set Web symbols for layers in iClient, perform data-driven mapping, and customize Web symbol styles.
- Mapping Workflow: A complete mapping workflow using Web symbols in iClient, starting from creating a new page file.
- Examples: Development examples provided by iClient for MapboxGL, namely Web Symbol gallery and Web Symbol Editor.
# Support Details
iClient for MapboxGL currently covers most of the basic symbols in iDesktop/iDesktopX products, and here are the support details of Web symbols:
| Basic Symbols in iDesktop/iDesktopX | Web Symbol Support | |
|---|---|---|
| Point Symbols | City | √ |
| Administrative Rank Group symbols | √ | |
| Population Grade | √ | |
| Residential areas and facilities | √ | |
| Positioning basics | √ | |
| Weather Forecast | √ | |
| Traffic | √ | |
| River | √ | |
| Land survey | - | |
| Flood Control and Drought Relief | - | |
| Landforms | - | |
| Pipelines | - | |
| Line Symbols | Administrative boundaries | √ |
| Traffic | √ | |
| Water systems | √ | |
| Road terminology | √ | |
| Subway | √ | |
| Positioning basics | √ | |
| Residential areas and facilities | √ | |
| Others | √ | |
| Land Investigation | - | |
| Flood Control and Drought Relief | - | |
| landform | - | |
| Pipelines | - | |
| Fill Symbols | HTML Named Colors | √ |
| Classification land color | √ | |
| Land planning classification | √ | |
| Common area colors | √ | |
| Web security colors | √ | |
| Crayon colors | √ | |
| Land survey style | - | |
# Mapping Effects
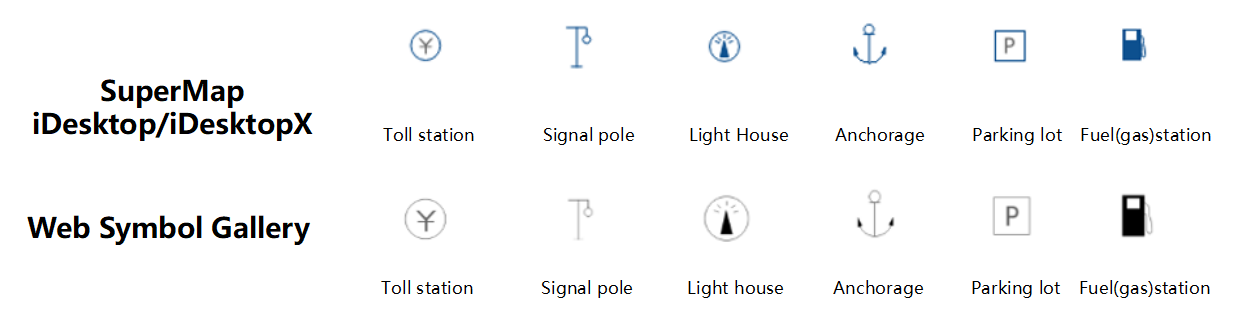
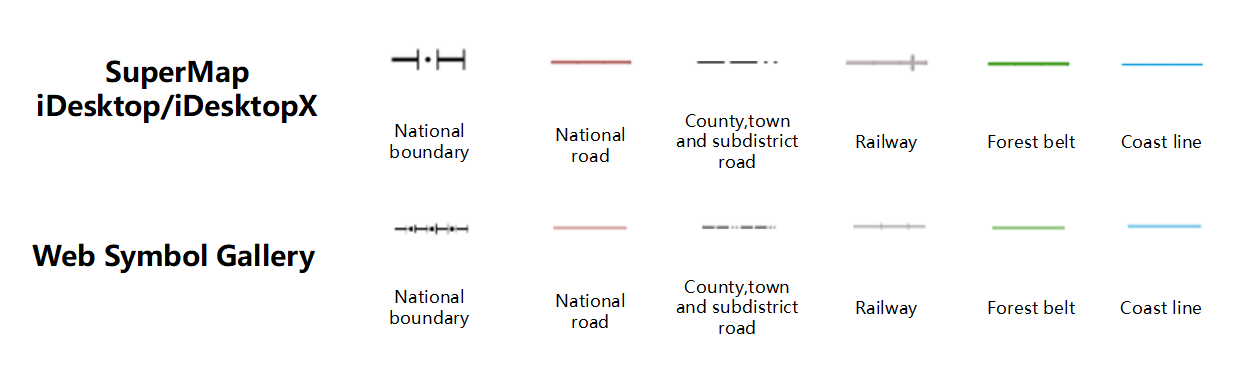
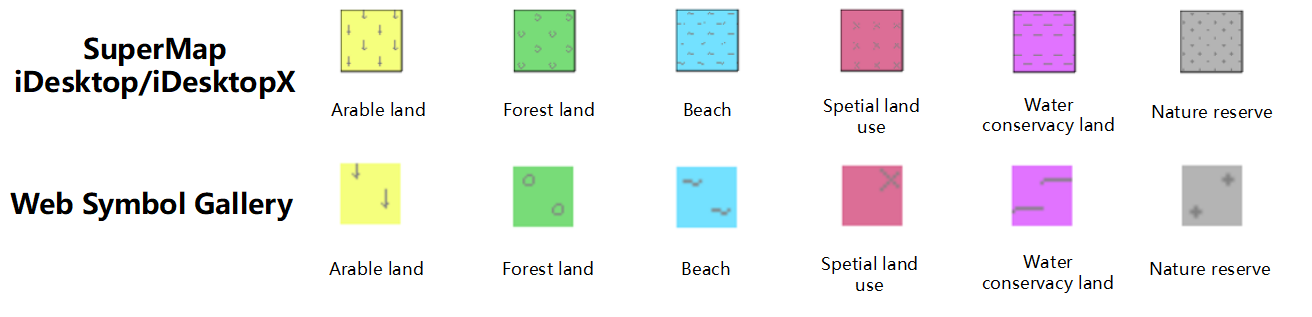
Using Web symbols in iClient, we can quickly produce a base map that is consistent with the symbols in Supermap iDesktop/iDesktopX. Here we compare the symbols in Web symbol gallery and desktop product:
- Point symbol style, these example are traffic symbols in the basic symbol.
- Line symbol style, these example are administrative boundaries symbols in the basic symbol.
- Fill symbol style, these example are land classification symbols in the basic symbol.
Comparison of drawing effect between Web symbols and desktop symbols:
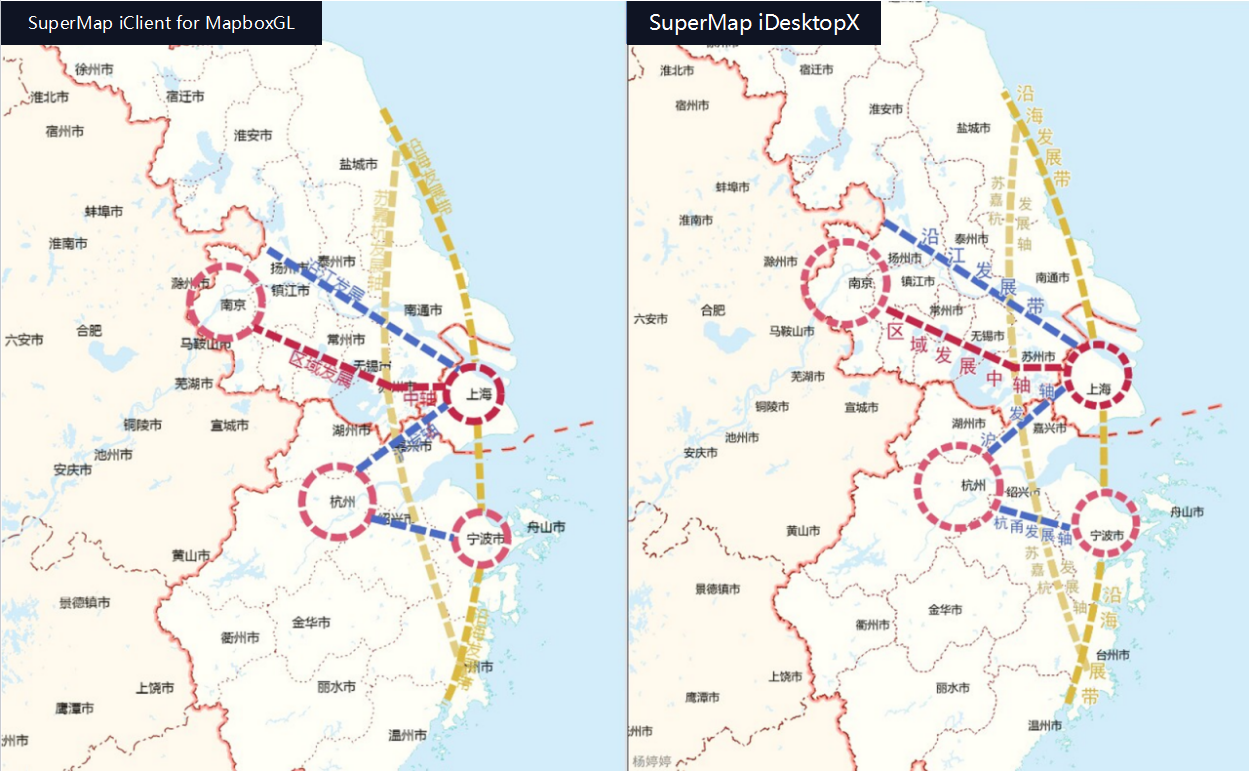
View more maps created by WebSymbol:iClient for MapboxGL | Visualization | WebSymbol (opens new window).
# How to Use Web Symbols
Web symbols are symbol objects composed of paint (opens new window) and layout (opens new window) properties specified in the Mapbox style specification. The paint and layout properties define the symbols style together (excluding visibility property in layout). Please see: iClient for MapboxGL | API | WebSymbol (opens new window).
This section introduces the basic usage of Web symbols, including setting layer symbols, creating data-driven maps, and customizing Web symbol styles. For detailed usage instructions, please see: iClient for MapboxGL Developer Guide | Web Symbols (opens new window) .
# Set Layer Symbols
iClient for MapboxGL supports quickly setting layer symbols by directly inputing symbol IDs from Web symbol gallery. The main steps and code are as follows:
(1) Configure the symbol resource path:
(2) Get the Web symbol ID, this can be a Web symbol ID provided in Web Symbol gallery (opens new window), or the ID of a custom Web symbol.
(3) Load and add the Web symbol by Using loadSymbol and addSymbol to load the Web symbol.
(4) Use addLayer method to add a layer to the map, specify the symbol ID or a symbol expression in the symbol property to set the Web symbol for the layer.
Note: iClient for MapboxGL extends the MapboxGL API and add a new symbol property to the existing properties of Mapbox Layers. Therefore, when using addLayer or setStyle API, you can specify the symbol ID or symbol expression to set the symbol style.
// set basepath of Web Symbol resources
new mapboxgl.supermap.WebSymbol().init({basePath:"./resources/symbols"});
// WebSymbol ID
const symbolId = "line-962613";
// load WebSymbols
map.loadSymbol(symbolId, (error, symbol) => {
    if (error) throw error;

    // Add WebSymbol to the map
    map.addSymbol(symbolId, symbol);
    // Add WebSymbol to the assigned layer
    map.addLayer({
        "id": "pl@landuse(0_24)",
        "source": "landuse",
        "source-layer": "pl@landuse",
        "type": "line",
        "symbol": symbolId
    });
});
# Data-Driven Mapping
When using addLayer or setSymbol to set Web symbols for layers, besides specifying a uniform symbol for a single layer through a symbol ID, you can also utilize MapboxGL expressions supported by symbols to assign different symbols to features with different attributes within the layer in a data-driven manner.
- Use
addLayerand Match expression to create line layers with line symbols in data-driven manner.
map.setSymbol("layerId", [
    "match",
    ["get", "DLBM"],
    "011", "line-964458", // Highway Land
    "013", "line-964462", // Rural Roads
    "021", "line-962613", // River Surface Area
    "023", "line-962613", // River Surface Area
    "line-962613"
  ]);
- Use
addLayerand Case expression to create polygon layers with fill symbols in data-driven manner.
map.addLayer({
    "id": "PopDensity_R@Population",
    "source": "Spatial distribution map of national population density",
    "source-layer": "PopDensity_R@Population",
    "type": "fill",
    "symbol": [
      "case",
      ["all", ["<=", ["get", "dMaxZValue"], 70]], "PoPdensity_R_MAX70",
      ["all", [">", ["get", "dMaxZValue"], 70],["<=", ["get", "dMaxZValue"], 140]], "PoPdensity_R_MAX140",
      ["all", [">", ["get", "dMaxZValue"], 210],["<=", ["get", "dMaxZValue"], 280]], "PoPdensity_R_MAX280",
      ["all", [">", ["get", "dMaxZValue"], 350],["<=", ["get", "dMaxZValue"], 420]], "PoPdensity_R_MAX420",
      ["all", [">", ["get", "dMaxZValue"], 490],["<=", ["get", "dMaxZValue"], 560]], "PoPdensity_R_MAX560",
      ["all", [">", ["get", "dMaxZValue"], 640],["<=", ["get", "dMaxZValue"], 700]], "PoPdensity_R_MAX700",
      ["all", [">", ["get", "dMaxZValue"], 770],["<=", ["get", "dMaxZValue"], 1000]], "PoPdensity_R_MAX1000",
      ["all", [">", ["get", "dMaxZValue"], 1000]], "PoPdensity_R_Exceed1000",
      "Country_R"
    ]
  });
# Customize Symbols
It supported to customize Web symbol styles based on symbol specifications. You can create entirely new Web symbols or modify the paint and layout properties of existing Web symbols (the visibility property in layout is not currently supported). You must assigned a unique ID to the custom Web symbol. And apply the custom symbol to a layer by specifying its ID.
- Create Custom Point Symbols
It supports to customize point symbol styles such as the image, size, offset, opacity, etc. Please see: Mapbox GL JS | STYLE SPECIFICATION | layers | symbol (opens new window).
// Load the image of the custom point symbol
map.loadImage("../img/cirecleRed.png", (error, image) => {
    if (error) throw error;
    // Custom image of Web point symbol
    const imageId = "cityPoint";
    // Add image of point symbol to the map
    map.addImage(imageId, image);
    // Custom Web point symbol
    const customPointSymbol = {
        "paint": {
            "icon-translate": [0, 4]
        },
        "layout": {
            "icon-image": imageId,
            "icon-size": 0.1
        }
    };

    //Custom Web point symbol ID
    const pointSymbolId = "Province_P";
    // Add Web point symbol to the map
    map.addSymbol(pointSymbolId, customPointSymbol);
  }
);
- Create Custom Line Symbols
It supports to custom line symbol styles such as line width, color, cap, joins, etc. Please see: Mapbox GL JS | STYLE SPECIFICATION | layers | line (opens new window).
// Custom Web line symbol
const customLineSymbol = {
    "paint": {
        "line-width": 0.38,
        "line-dasharray": [
            2.5,
            2
        ],
        "line-color": "#AE10FC"
    }
};
// Custom web Line Symbol ID
const lineSymbolId = "Province_L";
// Add Web line symbols to the map
map.addSymbol(lineSymbolId, customLineSymbol);
- Custom Polygon Symbols
It supports to configure attributes of solid fill polygon symbols, such as the color, opacity, the color of outer border lines, anti-aliasing, etc. please see: Mapbox GL JS | STYLE SPECIFICATION | layers | fill (opens new window).
map.addSymbol("custom_fill_ID", {
        paint: {
          "fill-color": "rgba(246,229,255,1.00)",
          "fill-opacity": 0.5,
          "fill-outline-color": "rgba(145,223,158,1.00)",
          "fill-antialias": true
        }
      });
- Modify Existing Web Symbols
First, load the Web symbol that needs to be modified by using loadSymbol. Then, modify the paint and layout properties of the symbol. To distinguish the modified symbol from the original one, it will use a new ID to identify the modified Web symbol.
const loadPreSymbol = async (preSymbolInfo) => {
        const { symbolId, style ={} } = preSymbolInfo;
        const id = uniqueId();
        await map.loadSymbol("point-1", (err, symbol) => {
              if (!err) return;
              symbol.paint["icon-color"] = "red";
              map.addSymbol("start", symbol);
            });
        return { id, symbolId };
    }
# Mapping Workflow
In the previous section, we provided a detailed introduction to use Web symbols. Now we will guide you how to create maps by using Web symbols in iClient, The specific steps start with creating a basic HTML file:
# 1.Create a HTML File
Create a new HTML file and set it like the following basic format:
<!DOCTYPE html>
<html lang="zh">
  <head>
    <meta charset="UTF-8">
    <meta name="viewport" content="initial-scale=1.0, user-scalable=no, width=device-width">
    <title>Landuse</title>
    <style>
      body {
        margin: 0;
        padding: 0;
      }
      #map {
        position: absolute;
        top: 0;
        bottom: 0;
        width: 100%;
      }
    </style>
  </head>
</html>
# 2.Import
During development, you need to import MapboxGL v1 and SuperMap iClient for MapboxGL by files or npm. Additionally, to use Web symbols, you need to specify the path to the symbol resources. Please refer to: iClient for MapboxGL | Developer Guide | Web Symbol | Import (opens new window).
# 3.Add Map
(1) Add the following code within the <body> tag to create a map container:
<div id="map"></div>
(2) Add the following code within a <script> tag to create a map object. The map data comes from the vector tiles of a land use map provided by SuperMap iServer. The container specifies the map container created in the previous step.
var serverUrl = "https://iserver.supermap.io/iserver/services/map-mvt-landuse2/rest/maps/landuse";
var map = new mapboxgl.Map({
      container: "map",
      style: {
        "sources": {
          "landuse": {
            "tiles": [
              serverUrl + "/tileFeature.mvt?z={z}&x={x}&y={y}"
            ],
            "type": "vector"
          }
        },
        "name": "landuse",
        "layers": [],
        "version": 8
      },
      minZoom: 11,
      maxZoom: 15,
      zoom: 13,
      center: [
        108.9131713726414,
        23.82622655814832
      ]
    });
# 4.Use Web Symbols
Specify different Web symbols for different landuse types by data-driven approach. First, create a method to add the layer and specify the Web symbols to the layer. Then, add the layer to the map in the map load event.
(1) Create createLineLayer method to add line layers to the map, And specify the Web symbols used by line layers in a data-driven manner.
var createLineLayer = function () {
  map.addLayer({
    "id": "pl@landuse(0_24)",
    "source": "landuse",
    "source-layer": "pl@landuse",
    "type": "line",
    "symbol": [
      "match",
      ["get", "DLBM"],
      "011", "line-962543", // Highway Land
      "013", "line-962524", // Rural Roads
      "021", "line-962613", // River Surface Area
      "023", "line-962613", // River Surface Area
      "line-964935"
    ]
  });
};
(2) Create method createPolygonLayer to add polygon layers to the map, And specify the Web symbols used by polygon layers in a data-driven manner.
// Add polygon layers
var createPolygonLayer = function () {
  map.addLayer({
    "id": "landuse@landuse(0_24)",
    "source": "landuse",
    "source-layer": "landuse@landuse",
    "type": "fill",
    "symbol": [
      "match",
      ["get", "DLBM"],
      "011", "polygon-955880", //Paddy Field
      "013", "polygon-955464", //Dry Land
      "021", "polygon-955519", //orchard
      "023", "polygon-955879", //Other Horticultural Land
      "031", "polygon-955483", //Wooded Land
      "032", "polygon-955537", //Shrub Land
      "033", "polygon-955878", //Other Forested Land
      "043", "polygon-955398", //Other Grassland
      "127", "polygon-955385", //Bare Land
      "201", "polygon-955872", //Urban Area
      "203", "polygon-955527", //Village
      "101", "polygon-955452", //Railway Land
      "102", "polygon-955550", //Highway Land
      "104", "polygon-955550", //Rural Road
      "117", "polygon-955400", //Canal/Ditch
      "118", "polygon-955545", //Hydraulic Structure
      "122", "polygon-955529", //Agricultural Facility Land
      "204", "polygon-955532", //Mining Land
      "205", "polygon-955433", //Scenic Spot and Special Land Use
      "111", "polygon-955871", //River Surface
      "112", "polygon-955871", //Lake Surface
      "113", "polygon-955875", //Reservoir Surface
      "114", "polygon-955525", //Pond Surface
      "116", "polygon-955508", //Inland Mudflat
      "polygon-0"
    ]
  });
};
(3) In the map loading event, configure the base path of the Web symbol resource, and then use the method map.loadSymbol to load the Web symbols used in the landuse map in bulk. Then use the methods createLineLayer and createPolygonLayer to add a line layer and a polygon layer with the specified Web symbols to the map.
map.on("load", function () {
  // Configure the base path for Web symbol resources
  new mapboxgl.supermap.WebSymbol().init({basePath: window.exampleWebSymbolBasePath});
  // bulk load Web symbols
  var symbolIds = [
    "polygon-955452",
    "polygon-955550",
    "polygon-955871",
    "polygon-955875",
    "polygon-955525",
    "polygon-955508",
    "polygon-955400",
    "polygon-955545",
    "polygon-955529",
    "polygon-955385",
    "polygon-955872",
    "polygon-955527",
    "polygon-955532",
    "polygon-955433",
    "polygon-955880",
    "polygon-955464",
    "polygon-955519",
    "polygon-955879",
    "polygon-955878",
    "polygon-955483",
    "polygon-955537",
    "polygon-955398",
    "polygon-0"
  ];
  map.loadSymbol(symbolIds, function (_error, symbols) {
      symbols.forEach((symbol, index) => {
        symbol && map.addSymbol(symbolIds[index], symbol);
      });
      createPolygonLayer();//Add polygon layer to the map
      createLineLayer();//Add line layer to the map
    });
});
# 5.Visualization Effect
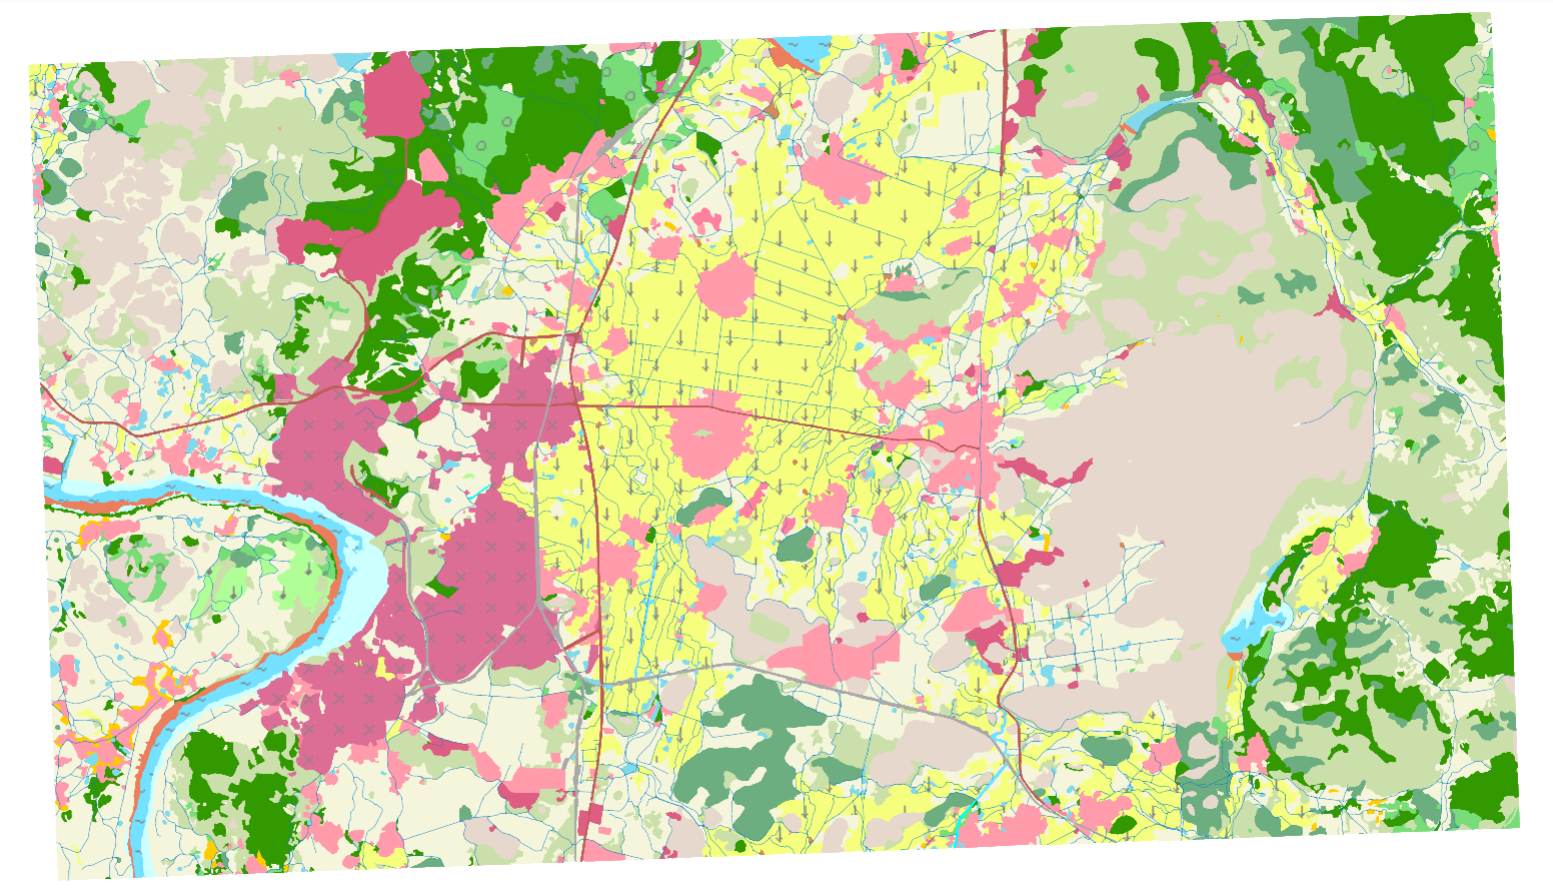
Now you have crated a landuse map using Web symbols successfully. Open the HTML page in the browser, and you can view the mapping effect. Click to see the example and complete code: iClient for MapboxGL | examples | land use map (opens new window).
# WebSymbol Examples
iClient for MapboxGL provides a series of WebSymbol samples. This section will introduce the WebSymbol gallery and WebSymbol editor, and there are several WebSymbol mapping results in iClient for MapboxGL | visualization | WebSymbol (opens new window).
# WebSymbol Gallery
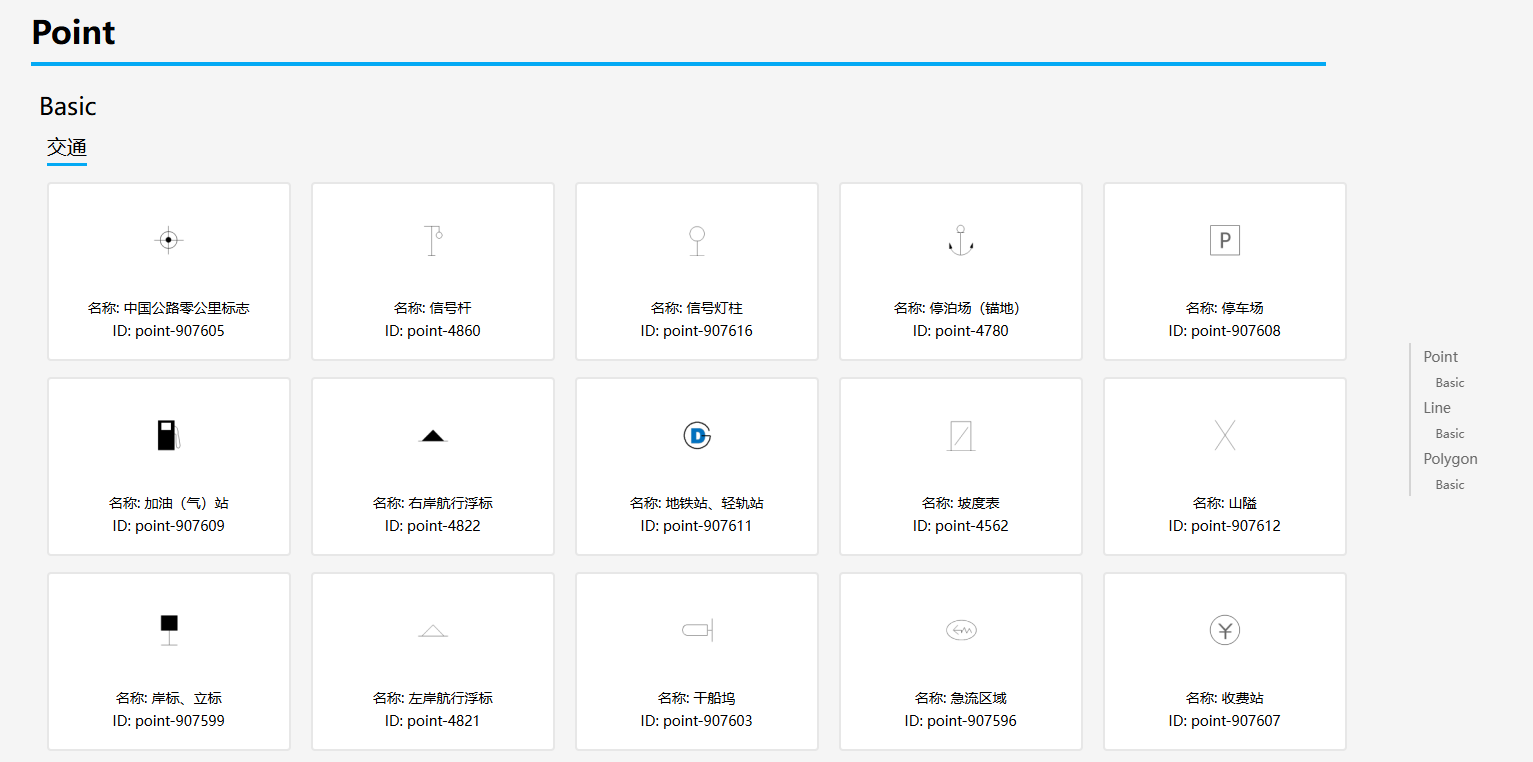
In order to help users understand the implementation of symbols supported by the WebSymbol gallery, IClient for MapboxGL provides a WebSymbol gallery (opens new window) example to lists all currently supported Web symbols and provides every symbols' name, display effect, and ID. Click one symbol to see the implement code.
# WebSymbol Editor
To help users understand the capabilities of custom Web symbols in iClient, In WebSymbol editor (opens new window) example, you can make online style edits to symbols provided in WebSymbol gallery, and show the effect of custom Web symbols in the map. It support the following symbol styles:
- Point symbols: color, size, opacity, translate, rotate;
- Line symbols: color, opacity, width, offset, blur, join, cap, translate;
- Polygon symbols: color, opacity.