# FlatGeobuf format
# Overview
FlatGeobuf (FGB) is a binary coding format used to store the coordinates and types of geographical features, which can store the features in simple feature specification (opens new window), such as point, line, polygon, etc.
The FGB format is similar to traditional file formats such as Shapefile and GeoJSON, supports the storage of geospatial vector data. However, the FGB format obtains higher storage efficiency and faster read/write speeds, making it suitable for encoding and transmitting large amounts of static data. Storing and transmitting data in FGB format can accelerate network transmission speeds and reduce the rendering time of vector elements, which can optimize the user experience.
To facilitate your understanding of the generation and use of FGB data, this document provides two scenarios for generating and using FGB data. You can choose the one that best suits your needs.
- FGB Data Generation and usage scenario 1: Using SuperMap iServer to query or analyze and generate results in FGB format, and then storing these analysis results (or any other FGB data from other sources) as static data in an object-based storage service. Thus you can access and visualize the FGB data at any time in iClient. This scenario is suitable for displaying static analysis results.
- FGB Data Generation and usage scenario 2: In SuperMap iClient, by using the service capabilities of iServer, you can analyze and return results in FGB format, and then visualize these results. This scenario is suitable for situations that the data needs to be analyzed and displayed in real time.
Support for FGB format
Cloud GIS Web iClient Development Platform -- SuperMap iClient for Leaflet / OpenLayers / MapboxGL / MapLibreGL, all support FGB format data.
Among the service capabilities provided by the SuperMap iServer, in addition to support generating analysis results in JSON or GeoJSON format, the following service capabilities now also support generating analysis results in FGB format.
| Service ability | Service | |
| Map | Map Query | queryResult |
| Data | Data Query | featureResult |
| Spatial Analyst(dataset) | dataset buffer analysis | datasetBufferResult |
| dataset overlay analysis | datasetOverlayResult | |
| dataset isoline analysis | datasetIsolineResult | |
| dataset isoregion analysis | datasetIsoregionResult | |
| dataset Thiessen Polygon | datasetThiessenPolygonResult | |
| Spatial Analyst(geometry) | geometry buffer analysis | geometryBufferResult |
| geometry overlay analysis | geometryOverlayResult | |
| geometry isoline analysis | geometryIsolineResult | |
| geometry isoregion analysis | geometryIsoregionResult | |
| geometry thiessen polygon | geometryThiessenPolygonResult | |
| Network Analysis | connectivity analysis | connectedEdges |
| Upstream trace analysis | traceUp | |
| Downstream trace analysis | traceDown | |
Note 1: Please use the latest version of SuperMap iServer and SuperMap iClient JavaScript:
SuperMap iServer: http://support.supermap.com.cn/product/iServer.aspx (opens new window)
SuperMap iClient JavaScript: http://support.supermap.com.cn/product/iClient.aspx (opens new window)
Note 2: To publish services in SuperMap iServer, you need to have the SuperMap iServer product and possess the role of either System Administrator (ADMIN) or Service Publisher (PUBLISHER).
# FGB Data Generation and usage scenario 1
In SuperMap iServer (iServer), you can use the services provided in Table 1 to query or analyze data, generate analysis results in FGB format, and store them locally for easy access and loading in iClient at any time.
This chapter takes SQL Query in Data Query service capability as an example to introduce the process of analyzing and generating FGB data in iServer, and storing it in object-based storage service, finally visualizing it in iClient.
# 1.Publish data service
Here we use the map World_Common in sample data SampleData2D provided by the SuperMap official website (download: Technology resource center | Download sample map (opens new window)), and publish it as a data service in iServer.
1.Startup iServer: run startup.bat (Windows OS) or startup.sh (Linux OS) in the bin directory of iServer to startup it.
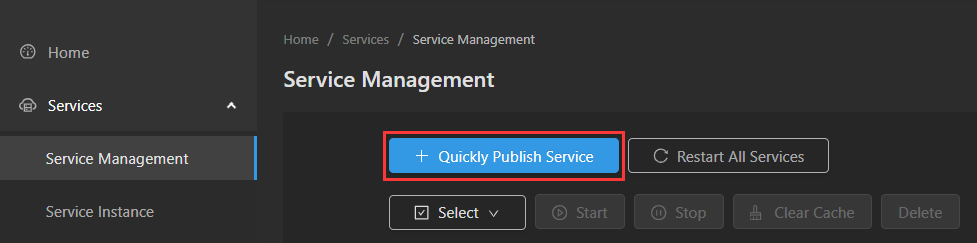
2.Open a browser, enter the address of iServer management page (http://<server>:<port>/iserver/admin-ui/services/serviceManagement) and login administrator account. Then click Services - Service Management in the left navigation > click Quickly Create Services in the right panel to create service.
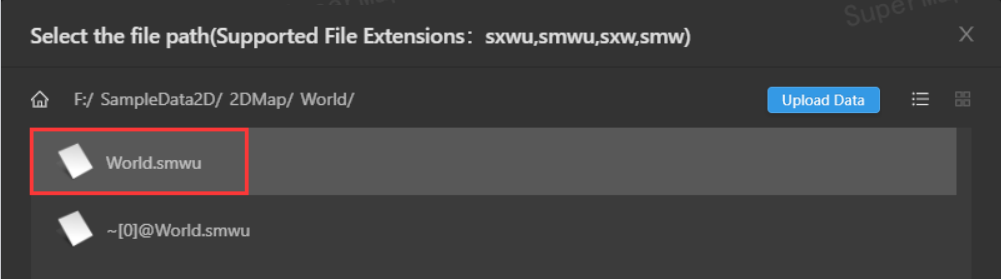
3.In Publish service page, select File Workspace as the data source > click Next > click Upload Data to upload the workspace World.smwu. The path of this workspace in the sample data archive: [Example data package]/2DMap/World/world.smwu.
4.Select the service type REST- Data Service, then click Next to configure the map service, because there is no configuration item for the selected service, click Publish to publish the service.
5.Browse datasource and dataset information: Open the address of Data-World data service, click data in next level > select datasources in Child resources > click World in Datasources to view the details, then click datasets to view the information of each dataset.
# 2.Analize and generate FGB data
In this section, we will use World_Common data to run SQL query and generate the query results in FGB format.
1.Click data Service in iServer service list > open the address of Data-World data service > click data in next level > click featureResults in Child resources to access the featureResult resource page.
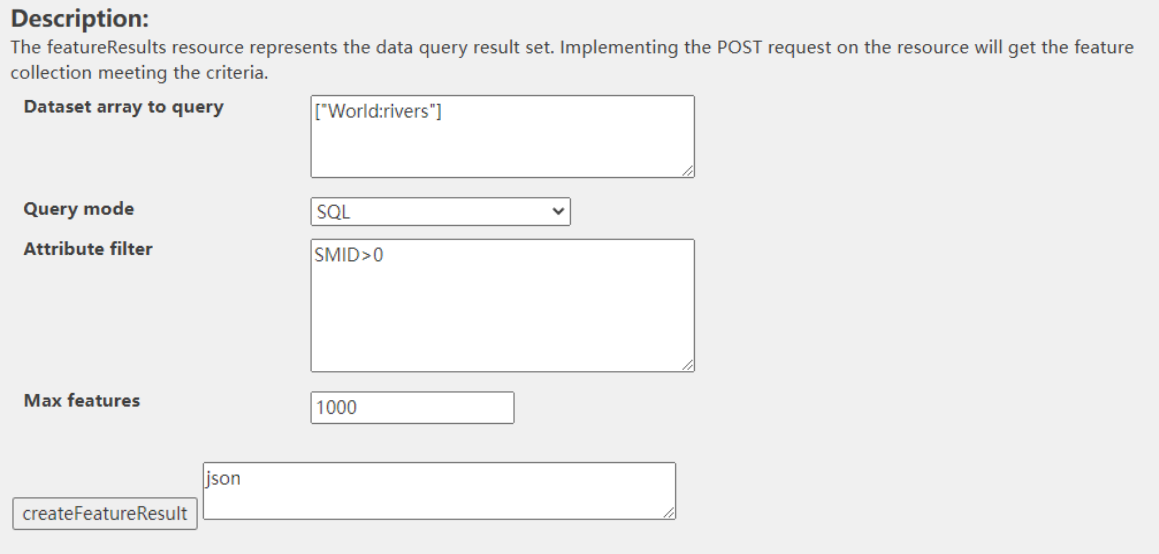
2.In the featureResult resource page, enter ["World:rivers"] in the text box > select SQL for the query mode > enter SMID>0 in the feature filter > click createFeatureResults to query data. The parameter explanations are as follows:
Dataset array to query: The format is: ["data source name: dataset name"], you can get datasource and dataset name from Browse Data Source and Dataset Information step in FGB Data Generation and Usage Scenario 1 > Step 1 Publish Data Service;
Query mode: Provide ID, SQL, range, geometry, buffer and aggregate query modes. Selecte a query mode, it will show the corresponding query filters.
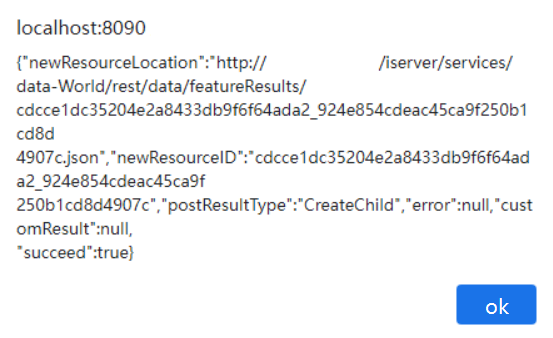
3.Click createFeatureResults to run the SQL query, a message box will pop up and display detailed information about the data query operation.
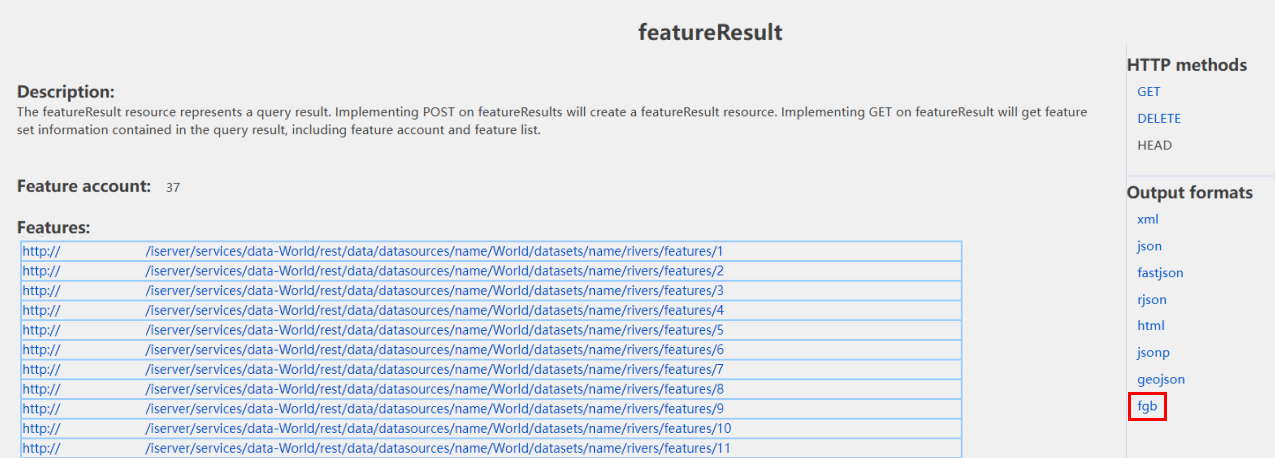
4.After the data query is successfully executed, click featureResult link at the bottom of the featureResults resource page to browse the data query results, and the service address of each query result will be displayed in the feature list. Click fgb in the output format list to download the data query results in FGB format to your local device.
# 3.FGB data storage
After downloading the analysis results in FGB format, it can be stored in the object-based storage service by importing or uploading, so that the FGB data stored in the object-based storage service can be loaded in iClient at any time.
- Object-based Storage is a distributed storage architecture that manages data in the form of objects, combining the characteristics of high-speed direct access to disks and distributed sharing. Spatial object-based storage service provides a Web service API based on HTTP/HTTPS protocol. Users can access the data stored in the object-based storage service at any time.
SuperMap GIS product incorporates the cloud-native distributed object storage service MinIO, providing deployment, operation, and maintenance management capabilities for object storage environments. In versions above 11.0.0, SuperMap iManager supports one-click creation of a MinIO environment, making it an excellent choice for storing FGB data. When FGB data is needed, you can obtain the access link for the FGB data from MinIO, enabling access and visualization of the FGB data in iClient.
Besides MinIO, you can also use other commonly used cloud object storage services, such as Alibaba Cloud Object Storage Service (OSS), Huawei Cloud Object Storage Service (OBS), Tencent Cloud Object Storage (COS), Amazon Simple Storage Service (Amazon S3) in the commercial sector, as well as Ceph and other options in the open-source domain.
# 4.FGB Data visualization
iClient supports to visualize FGB data stored in the object-based storage service. In this section, you will create a simple HTML page and set up the development environment based on SuperMap iClient for Leaflet, and load the FGB data stored in the object-based storage service into the page in the form of FGB layers.
1.Import the development files
(1) Create a new HTML file and set it like the following basic format:
<html>
  <head>
    <meta charset="UTF-8" />
    <title data-i18n="resources.title_fgb_all"></title>
  </head>
</html>
(2) In the <head> tag, include Leaflet CSS and JS file, and fill in the BootCDN hosting address.
    <link href="https://cdnjs.cloudflare.com/ajax/libs/leaflet/1.7.1/leaflet.css" rel="stylesheet"/>
    <script type="text/javascript" src="https://cdnjs.cloudflare.com/ajax/libs/leaflet/1.7.1/leaflet.js"></script>
(3) In the <head> tag, include iclient-leaflet CSS and JS file, and fill in the SuperMap iClient for Leaflet online site address.
    <link rel="stylesheet" href="https://iclient.supermap.io/dist/leaflet/iclient-leaflet.min.css"/>
    <script type="text/javascript" src="https://iclient.supermap.io/dist/leaflet/iclient-leaflet.js"></script>
2.Add basemap
(1) Create a <body> tag and set style, then create a <div> tag in <body> tag to add maps.
<body style="margin: 0; overflow: hidden; background: #fff; width: 100%; height: 100%; position: absolute; top: 0">
<div id="map" style="margin: 0 auto; width: 100%; height: 100%; position: absolute; top: 0; left: 0">
    </div>
</body>
(2) Create a <script> tag in <body> tag. Then define the following object in <script> tag, and add the basemap to the map container map. Learn more about TiledMapLayer: L.supermap.TiledMapLayer (opens new window).
- baseurl: The service address of basemap, here we fill in the Map-world service provided by iServer online site.
- map: Map object, used to add basemap and FGB layer, you can set map coordinate system, map center, zoom range, etc.
     var map, baseUrl = 'https://iserver.supermap.io/iserver/services/map-world/rest/maps/World',
      map = L.map('map', {
        preferCanvas: true,
        crs: L.CRS.EPSG4326,
        center: { lon: 110, lat: 30 },
        maxZoom: 18,
        zoom: 3
      });
      new L.supermap.TiledMapLayer(baseUrl).addTo(map);
3.FGB layer loading
(1) In <script> tag, load the FGB data generated by the SQL query into the map as FGB layer. Learn more about FGBLayer: L.supermap.FGBLayer (opens new window).
- fgburl: The service address of FGB data, here we fill in the access link of FGB data stored in the object-based storage service MinIO.
fgbUrl = 'http://127.0.0.1:9090/fgb/waterways.fgb?X-Amz-Algorithm=AWS4-HMAC-SHA256&X-Amz-Credential=03GN9N5HZMWQ67DKT1YH%2F20230315%2Fus-east-1%2Fs3%2Faws4_request&X-Amz-Date=20230315T030921Z&X-Amz-Expires=604800&X-Amz-Security-Token=eyJhbGciOiJIUzUxMiIsInR5cCI6IkpXVCJ9.eyJhY2Nlc3NLZXkiOiIwM0dOOU41SFpNV1E2N0RLVDFZSCIsImV4cCI6MTY3ODg4NjM5NCwicGFyZW50IjoiYWRtaW4ifQ.fCobv6HLmjWEVzLFttzLCvKiCeTU5wExvkiw_v8VnrG5aMVhtIXGeKt_kYSPp76UdtlQKn1a338Fkz6BEg4j8Q&X-Amz-SignedHeaders=host&versionId=null&X-Amz-Signature=a09c7c42a6c820965f7c7f9924e7f4e83569d1c05e68c15f7bb9cd3a268be388';
new L.supermap.FGBLayer(fgbUrl, {
        strategy: 'all'
      }).addTo(map);
(2) Open the HTML page in the browser, the FGB data is visualized as follow.
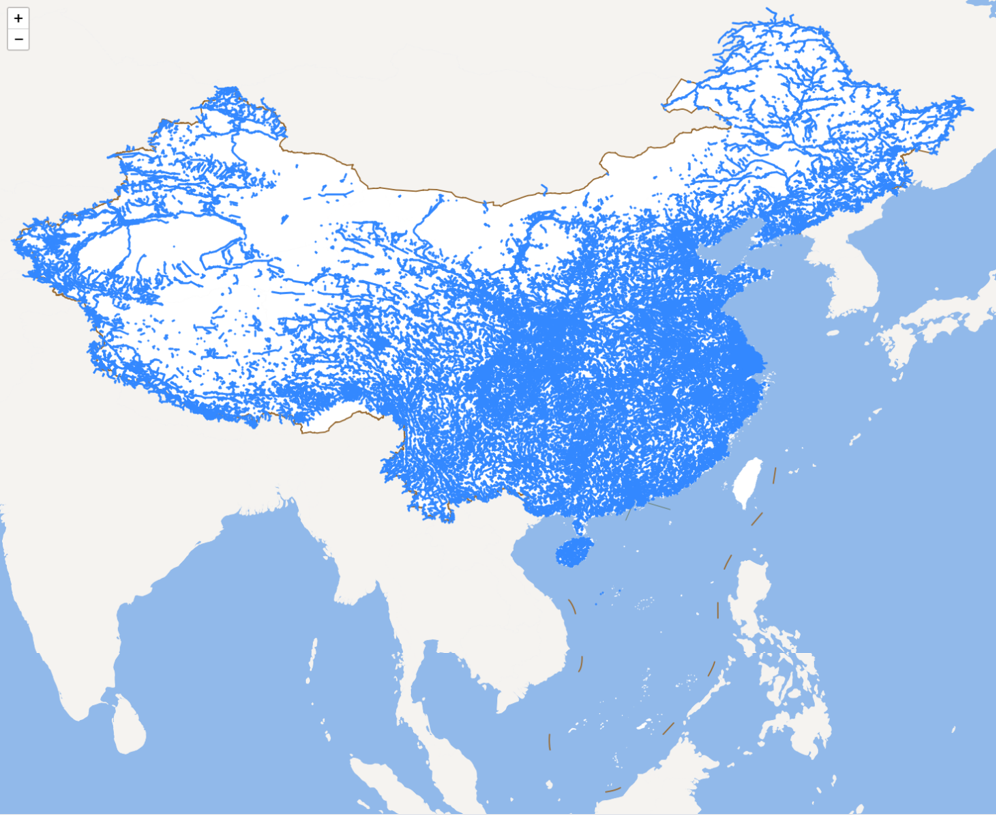
(3) The complete code of FGB data visualization:
<html>
  <head>
    <meta charset="UTF-8" />
    <title data-i18n="resources.title_fgb_all"></title>
    <link href="https://cdnjs.cloudflare.com/ajax/libs/leaflet/1.7.1/leaflet.css" rel="stylesheet"/>
    <script type="text/javascript" src="https://cdnjs.cloudflare.com/ajax/libs/leaflet/1.7.1/leaflet.js"></script>
    <link rel="stylesheet" href="https://iclient.supermap.io/dist/leaflet/iclient-leaflet.min.css"/>
    <script type="text/javascript" src="https://iclient.supermap.io/dist/leaflet/iclient-leaflet.js"
    ></script>
  </head>
  <body style="margin: 0; overflow: hidden; background: #fff; width: 100%; height: 100%; position: absolute; top: 0">
    <div id="map" style="margin: 0 auto; width: 100%; height: 100%; position: absolute; top: 0; left: 0">
    </div>
    <script type="text/javascript">
      var map,
      baseUrl = 'https://iserver.supermap.io/iserver/services/map-china400/rest/maps/China_4326',
      fgbUrl = 'http://127.0.0.1:9090/fgb/waterways.fgb?X-Amz-Algorithm=AWS4-HMAC-SHA256&X-Amz-Credential=03GN9N5HZMWQ67DKT1YH%2F20230315%2Fus-east-1%2Fs3%2Faws4_request&X-Amz-Date=20230315T030921Z&X-Amz-Expires=604800&X-Amz-Security-Token=eyJhbGciOiJIUzUxMiIsInR5cCI6IkpXVCJ9.eyJhY2Nlc3NLZXkiOiIwM0dOOU41SFpNV1E2N0RLVDFZSCIsImV4cCI6MTY3ODg4NjM5NCwicGFyZW50IjoiYWRtaW4ifQ.fCobv6HLmjWEVzLFttzLCvKiCeTU5wExvkiw_v8VnrG5aMVhtIXGeKt_kYSPp76UdtlQKn1a338Fkz6BEg4j8Q&X-Amz-SignedHeaders=host&versionId=null&X-Amz-Signature=a09c7c42a6c820965f7c7f9924e7f4e83569d1c05e68c15f7bb9cd3a268be388',
      map = L.map('map', {
        preferCanvas: true,
        crs: L.CRS.EPSG4326,
        center: { lon: 110, lat: 30 },
        maxZoom: 18,
        zoom: 3
      });
      new L.supermap.TiledMapLayer(baseUrl).addTo(map);
      new L.supermap.FGBLayer(fgbUrl, {
        strategy: 'all'
      }).addTo(map);
    </script>
  </body>
</html>
# FGB Data Generation and Usage Scenario 2
In SuperMap iClient for Leaflet, you can query or analyze data by using the service provided by iServer in Table 1, it will return the analysis results in FGB format. Then visualize results as FGB layers. It's convenient for real-time data analysis and displaying analysis results instantly.
The following content will continue to use SQL query as an example to introduce how to analyze, generate and visualize FGB data in iClient:
# Generate and visualize FGB Data
1.Import development files Follow the step of introduce development files in FGB Data Generation and Usage Scenario 1 > Step 4 Visualize FGB Data to build the iClient development environment.
2.Add basemap Follow the step of Add basemap in FGB Data Generation and Usage Scenario 1 > step 4 Visualize FGB Data, add basemap China_4326 to the map.
3.generate and visualize FGB data
(1) Use SQL query service in iServer to query the World_Common data, it will return query results in FGB type, and then use the callback function to add the query results in the form of an FGB layer to the map. View FGBLayer details: L.supermap.FGBLayer (opens new window).
function query() {
        //SQL query parameter
        var sqlParam = new L.supermap.GetFeaturesBySQLParameters({
          queryParameter: {
                name: "Countries@World",
                attributeFilter: "SMID = 234"//China continental region
          },
          datasetNames: ["World:Countries"]
        });
        //use SQL query service, and return the result of FGB type. Add the query result to the map in the form of FGB layer through callback function
        new L.supermap.FeatureService(url).getFeaturesBySQL(
          sqlParam,
          function (serviceResult) {
            new L.supermap.FGBLayer(serviceResult.result.newResourceLocation, {
              strategy: 'all'
            }).addTo(map);
          },
          'FGB'
        );
      }
query();
(2)Open the HTML page in the browser, the FGB data visualization effect is shown in the following figure, learn more examples: iClient | examples | FGB - SQL Query (opens new window)。
(3)The complete HTML code of FGB data generation and visualization:
<html>
  <head>
    <meta charset="UTF-8" />
    <title data-i18n="resources.title_fgb_all"></title>
    <link href="https://cdnjs.cloudflare.com/ajax/libs/leaflet/1.7.1/leaflet.css" rel="stylesheet"/>
    <script type="text/javascript" src="https://cdnjs.cloudflare.com/ajax/libs/leaflet/1.7.1/leaflet.js"></script>
    <link rel="stylesheet" href="https://iclient.supermap.io/dist/leaflet/iclient-leaflet.min.css"/>
    <script type="text/javascript" src="https://iclient.supermap.io/dist/leaflet/iclient-leaflet.js"></script>
  </head>
  <body style="margin: 0; overflow: hidden; background: #fff; width: 100%; height: 100%; position: absolute; top: 0">
    <div id="map" style="margin: 0 auto; width: 100%; height: 100%; position: absolute; top: 0; left: 0">
    </div>
    <script type="text/javascript">
      var map, baseUrl = 'https://iserver.supermap.io/iserver/services/map-china400/rest/maps/China_4326',
      map = L.map('map', {
        preferCanvas: true,
        crs: L.CRS.EPSG4326,
        center: { lon: 110, lat: 30 },
        maxZoom: 18,
        zoom: 4
      });
      new L.supermap.TiledMapLayer(baseUrl).addTo(map);
      query();
      function query() {
        var sqlParam = new L.supermap.GetFeaturesBySQLParameters({
          queryParameter: {
                name: "Countries@World",
                attributeFilter: "SMID = 234"
          },
          datasetNames: ["World:Countries"]
        });
        new L.supermap.FeatureService(url).getFeaturesBySQL(
          sqlParam,
          function (serviceResult) {
            new L.supermap.FGBLayer(serviceResult.result.newResourceLocation, {
              strategy: 'all'
            }).addTo(map);
          },
          'FGB'
        );
      }
    </script>
  </body>
</html>
# Change FGB layer style
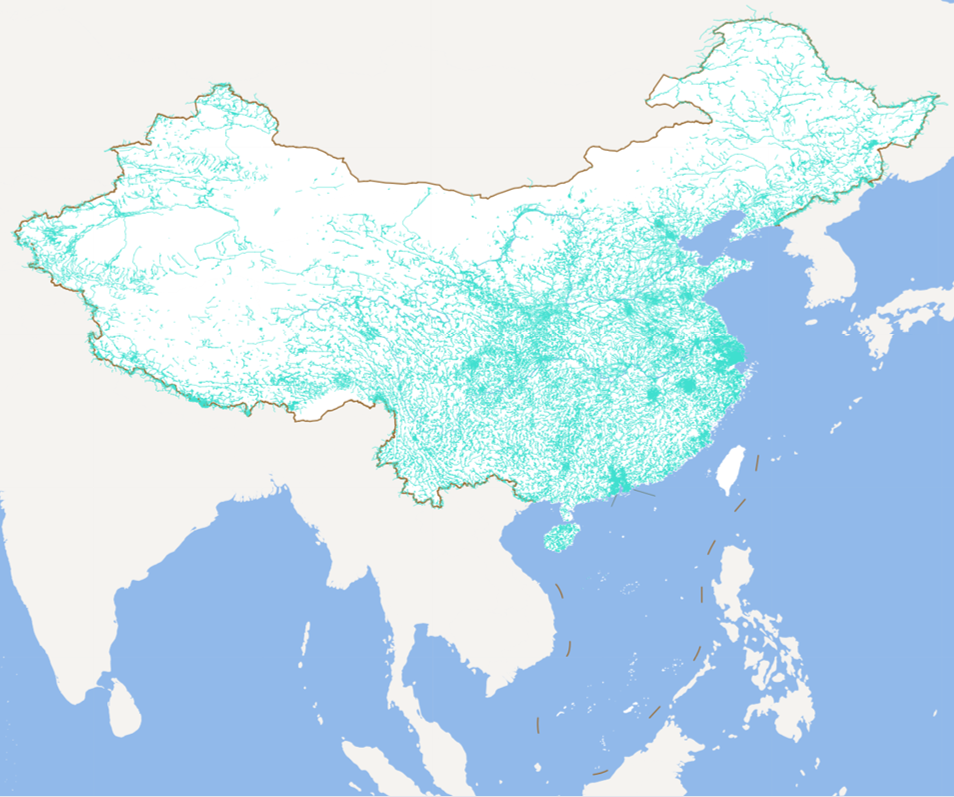
When loading FGB data in iClient, you can modify the style parameter of FGBLayer to define the style of point, line and polygon features. You can refer to L.Path-option (opens new window) to know the style types can be modified in style parameters. The following code sets the color, weight and opacity of line features in the FGB layer.
 new L.supermap.FGBLayer(fgbUrl, {
        strategy: 'all',
        style:{
          color:'#40E0D0',
          weight:1.5,
          opacity:0.5
        }
      }
    )
# FGB Data Loading Strategy
It may take a long time when loading massive FGB data in iClient. There are two loading strategies for FGB data: full load and extent load. You can set the strategy parameter to bbox (extent load) of FGBLayer to optimize the browsing experience for FGB data.
fgbUrl = 'http://127.0.0.1:9090/fgb/waterways.fgb?X-Amz-Algorithm=AWS4-HMAC-SHA256&X-Amz-Credential=03GN9N5HZMWQ67DKT1YH%2F20230315%2Fus-east-1%2Fs3%2Faws4_request&X-Amz-Date=20230315T030921Z&X-Amz-Expires=604800&X-Amz-Security-Token=eyJhbGciOiJIUzUxMiIsInR5cCI6IkpXVCJ9.eyJhY2Nlc3NLZXkiOiIwM0dOOU41SFpNV1E2N0RLVDFZSCIsImV4cCI6MTY3ODg4NjM5NCwicGFyZW50IjoiYWRtaW4ifQ.fCobv6HLmjWEVzLFttzLCvKiCeTU5wExvkiw_v8VnrG5aMVhtIXGeKt_kYSPp76UdtlQKn1a338Fkz6BEg4j8Q&X-Amz-SignedHeaders=host&versionId=null&X-Amz-Signature=a09c7c42a6c820965f7c7f9924e7f4e83569d1c05e68c15f7bb9cd3a268be388';
new L.supermap.FGBLayer(fgbUrl, {
        strategy: 'bbox'
      }).addTo(map);
- strategy: 'all': Requests the full data and renders it by reading the loaded data through streaming, please see: iClient | examples | FGB Full Load (opens new window);
- strategy: 'bbox': In the browser, only load data within the currently visible range and instantly load more data as the visible area changed, please seeiClient | examples | FGB Extent Load (opens new window)。