# Vector tiles thematic document
# Overview
With the development of Web GIS, users have higher demand for map display and transmission. Map tile is a effective way to improve the efficiency of map service access, which is a technology to improve operating efficiency and save working time. It is also a kind of map display technology widely used in mainstream geographic information systems. The appearance of this technology greatly shortens the users' waiting time, improves work efficiency, and makes the browsing process of map data become efficient and smooth.
Currently, there are raster tiles, vector tiles, and 3D tiles in SuperMap. Vector tiles divide and store the vector layers in the form of tiles. Compared with raster tile, vector tile has the advantages of infinitely scaling, style modification and relatively small amount of data, which can better meet the flexible and diverse Web map applications.
This document mainly describes the processes from vector map preparation, vector tile generation to visualization in SuperMap iClient JavaScript (hereinafter: iClient) for user reference.
# Prepare a vector map
Before generating vector tiles, we should prepare a valid vector map first. The point, line, polygon and text layers of SuperMap all support generating vector tiles, and most of symbolization, layer Settings and other styles of SuperMap map features can be supported by MapBox style. However, because the MapBox style is different from SuperMap, there are some limitations and precautions in the process of generating vector maps. To enhance generating efficiency and avoid the limitations of vector generating, you need to note the following points, and you can learn more details in: Vector Tiles Notice (opens new window).
- Coordinate systems: The coordinate system of the vector dataset should be consistent with the final map, which can skip the coordinate system conversion step and improve the efficiency in vector tile generation.
- Reduce data complexities: It ensures that the map object has reasonable complexity under different display scales, which can improve the efficiency of generating tiles and avoid obvious deformation of features caused by rarefying.
- Symbolizing map: Avoid creating maps with complex symbols that may not display correctly in vector tiles (unsupported symbols will be displayed as dots, solid lines, or solid color polygons in vector tiles).
- Text effect: The text in the map should be set to a fixed size and uniform style, otherwise there may be discrepancies between the text in the vector tiles and the original map. Only outline, bold and italic fonts are supported (the computer needs to have bold and italic font library of corresponding font). Shadow, underline, delete line and other text effects are not supported now.
- Create thematic map: Avoid single-valued label, segmented label, compound label and matrix label thematic maps in point, line, and polygon layers, they will not be processed when generating vector tiles. Avoid the offset setting of single-value thematic map and avoid using SQL statements to calculate label field in label thematic map.
- Restrict range of visible scale: It is recommended to set the visible scale range of the layer, which can improve the display performance of maps and the rendering efficiency of vector tile.
# Generate vector tile
Generating vector tile is an indispensable step before visualizing vector tiles in iClient. Here we provides two ways to generate vector tiles: pre-generate vector tiles and generate vector tiles dynamically.
- Pre-generate vector tiles: Pre-generate vector tile from vector maps in SuperMap iDesktopX (hereinafter: iDesktopX), then published it as map service through SuperMap iServer (hereinafter: iServer). In this way, the server can immediately use the vector tiles when iClient requests, so as to achieve low-latency tile rendering and visualization in iClient. The vector tiles generated by this method need to be re-sliced after the map is updated, which is suitable for situations where map updates are infrequent and there is a need to improve tile response efficiency. This method requires users to obtain iDesktopX, iServer, and iClient products.
- Generate vector tiles dynamically: Without Pre-generating vector tiles, publish the workspace of the vector map as a map service directly through iServer, and then send the request of using vector tile to iServer in iClient. The vector tiles of corresponding level and position will be generated dynamically in real time and returned to iClient for rendering visualization. The vector tiles generated by this method do not need to be re-sliced after the map is updated. This method is suitable for frequent map updates, and requires users obtain iServer and iClient products.
The two methods have their own characteristics and requirements, you can choose the appropriate method according to your needs. In addition, it both require your role in the iServer to be ADMIN or PUBLISHER.
Note: Please use SuperMap iDesktopX, iServer, and iClient in latest versions.
SuperMap iDesktopX: http://support.supermap.com.cn/product/iDesktopX.aspx (opens new window)
SuperMap iClient JavaScript: http://support.supermap.com.cn/product/iClient.aspx (opens new window)
SuperMap iServer: http://support.supermap.com.cn/product/iServer.aspx (opens new window)
# Pre-generate vector tiles
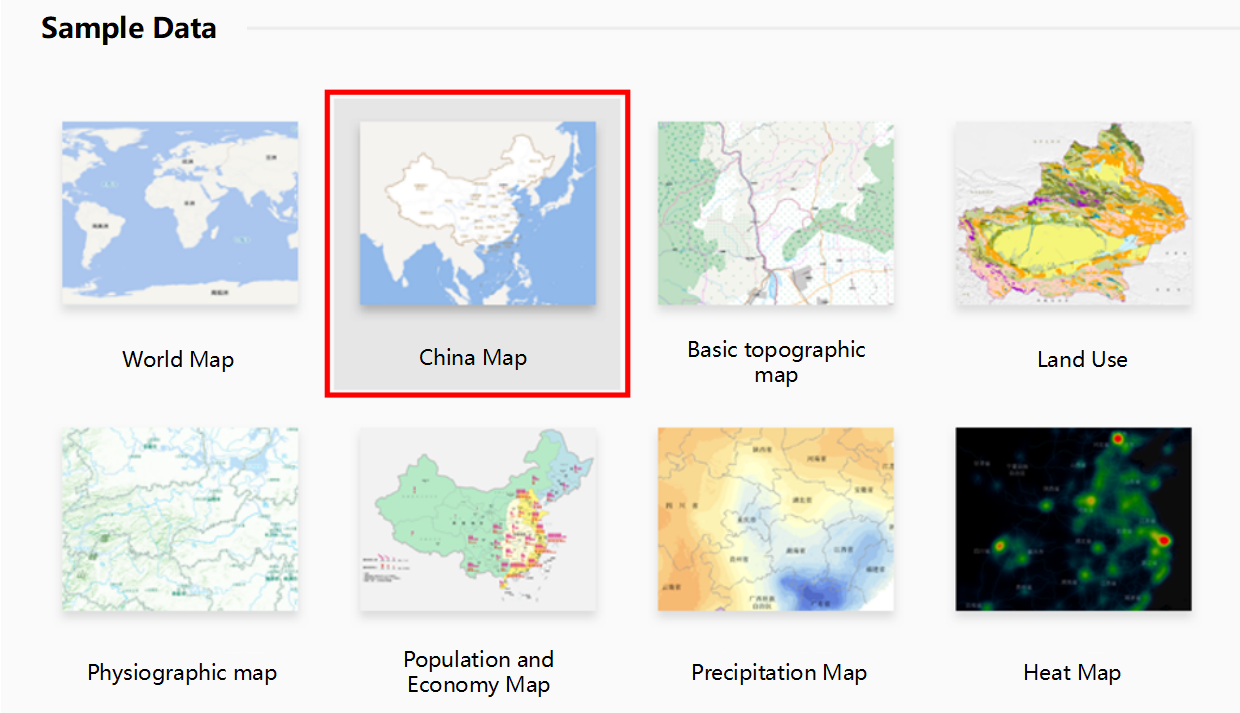
In this section, we will use the sample data China_Light in iDesktopX to generate vector tile. Firstly, pre-generate the vector tiles of China_Light map by generating Map Tiles(multi-task) in iDesktopX, and then publish the vector tiles to iServer in the form of map service and vector tile service, so that the vector tiles can be visualized in iClient. The specific operation steps are as follows:
# Generate Vector tiles in iDesktopX
- In Start Tab of iDesktopX, click China in the sample data, and the corresponding workspace will appear in Workspace Mmanager, then open the map China_Light under Maps.
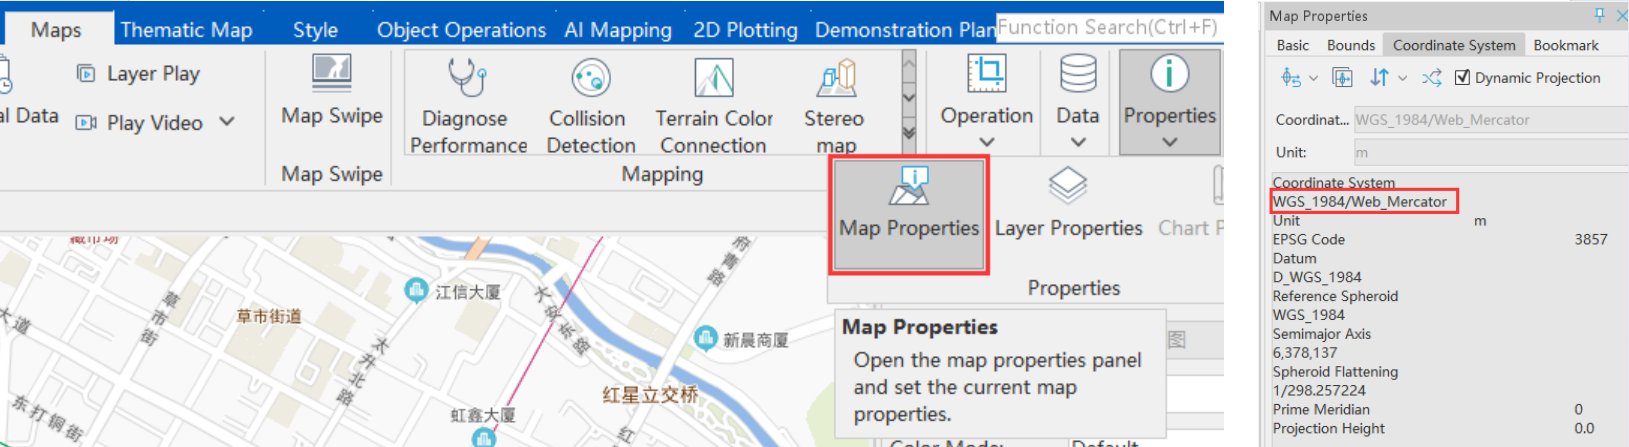
- Click Maps Tab > Properties > Map Properties, reset the map coordinate system to WGS_1984_Web_Mercator, and save the map.
- To ensure that the vector tiles can be generated correctly, please use a coordinate system with EPSGCode.
- In Workspace Manager, expand Datasources > right-click China > select Open as Read-only to set the data source to read-only, and save the workspace.
- Data source read-only: Map Tiles(multi-task) requires that UDB data sources are read-only, because each process will access the datasources of the map layer when execute Map Tiles(multi-task), thus the data source will be occupied. So set the data source as read-only to avoid that the data source being occupied and Map Tiles(multi-task) cannot be executed.
- In Workspace Manager, expand Maps > right-click the map China_Light > select Map Tiles (Multi-task) > select Create a New multitasking tile generation in the pop-up dialog box > click Next to pop up the Multi-task: Generate map tiles dialog box.
- Map Tiles (Multi-task): Based on the map's scale and scope, map tiles generating task will be divided into multiple subtasks. And then the subtasks will be deployed in a shared directory to facilitate simultaneous access by multiple computers. Multiple processes start at the same time, and each process will get and execute the subtask in the specified directory, and save the results to the same folder. Map Tiles (Multi-task) can make full use of the machine hardware resources, and comprehensively use multiple nodes to cut the map in parallel, which greatly improves the cutting efficiency. Please see: Multi-task Step (opens new window).
- The parameters for generating map tiles are set as follows:
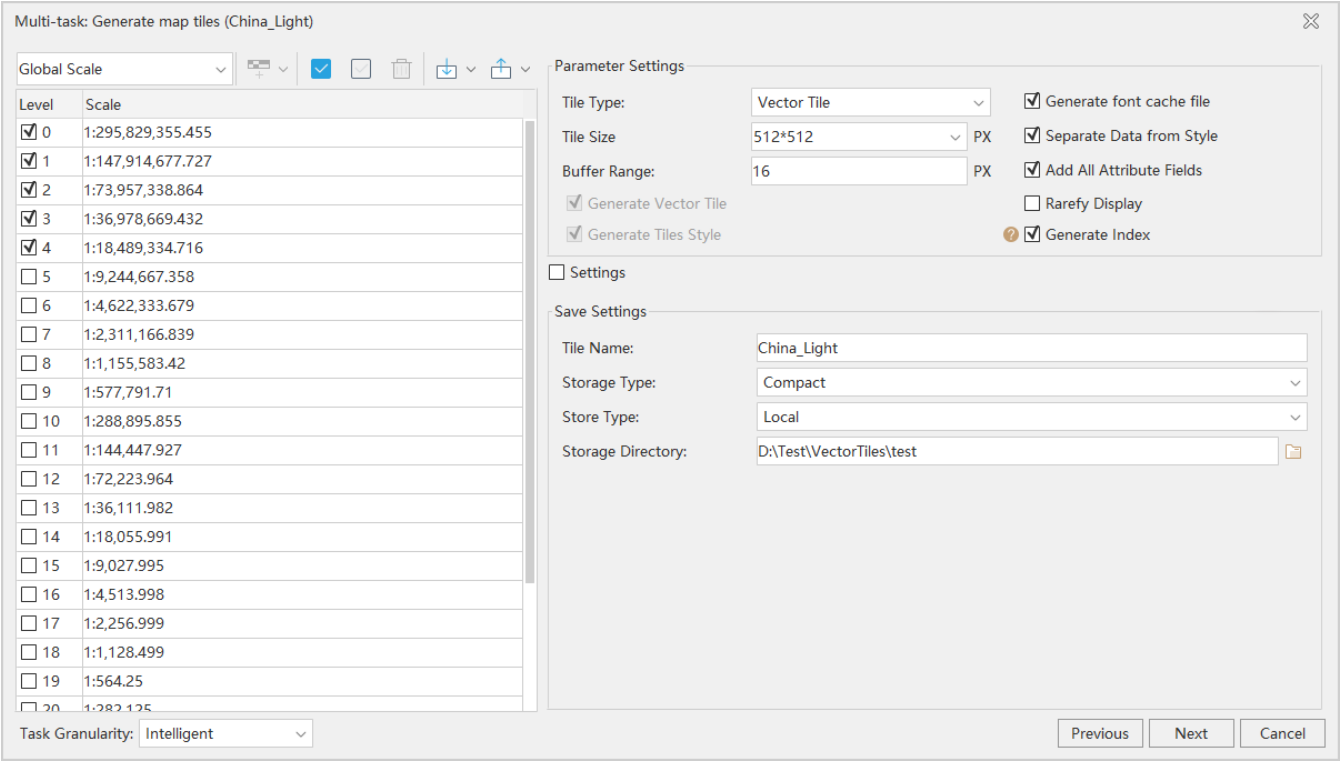
- Tile type: select 'Vector Tile';
- Scale: Set the global scale level to 0-5 on the left;
The vector tiles use the global Scale, the Custom Scale is not supported. - Rarefy Display: not checked;
If checked, the program will rarefy the geometric objects under small scale, which can reduce the node redundancy and improve the display performance. - Generate Index: checked;
If checked, when there are vector polygon in the generated vector tile, the vector polygon will be triangulated into a triangulated network, which can increase loading speed of vector tiles in WebGL. - Storage Directory: Set tile name and output path;
- Storage Type: select compact;
When the storage type is Compact, the original tile file will be compressed and encrypted. It is a tile mechanism that uses a set of files in structure instead of the original picture format. Origin: tile files are stored in a separate image file format on disk, and the data is not compressed and can be read directly. MongoDB: The generated tile file is stored in the server database in a distributed format, and an index file (*.sci) will be generated locally. Please see: Storage type of tile (opens new window). - Add All Attribute Fields: checked;
If checked, the tile result will contain all the non-system fields of the geometric objects in dataset. Otherwise, it will only output the fields used for the map display. - Buffer Range: default value is 16 in pixels;
Each tile is expanded around according to the set value, that is, the generated tile contains the data within the buffer range, so that the boundaries of adjacent tiles can be seamless. - Separate Data from Style: checked;
Check this option to separate data and style. If unchecked, do not separate. When users need to update the data or style of the vector tile separately latterly, they need to check this option. - Generate Vector Tile: When using multi-task to generate vector tiles, this option is checked by default and cannot be changed.
If checked, the resulting vector tiles will be stored in the tiles folder. - Generate Tiles Style: When using multi-task to generate vector tiles, this option is checked by default and cannot be changed.
Check this option to generate a *.json file containing the styles corresponding to the map transformation. The generated results will be stored in two folders: sprites and styles. - Generate font cache file: checked by default, it's changeable.
iDesktopX supports to generate tiles of the MapBox MVT specification, which is recommended to be checked.
After setting parameters, click Next to set the tile bounds. Here we keep the default bounds.
Click Next, it will popup the Generate Map Tiles by Multiple Tasks dialog box, and set parameters:
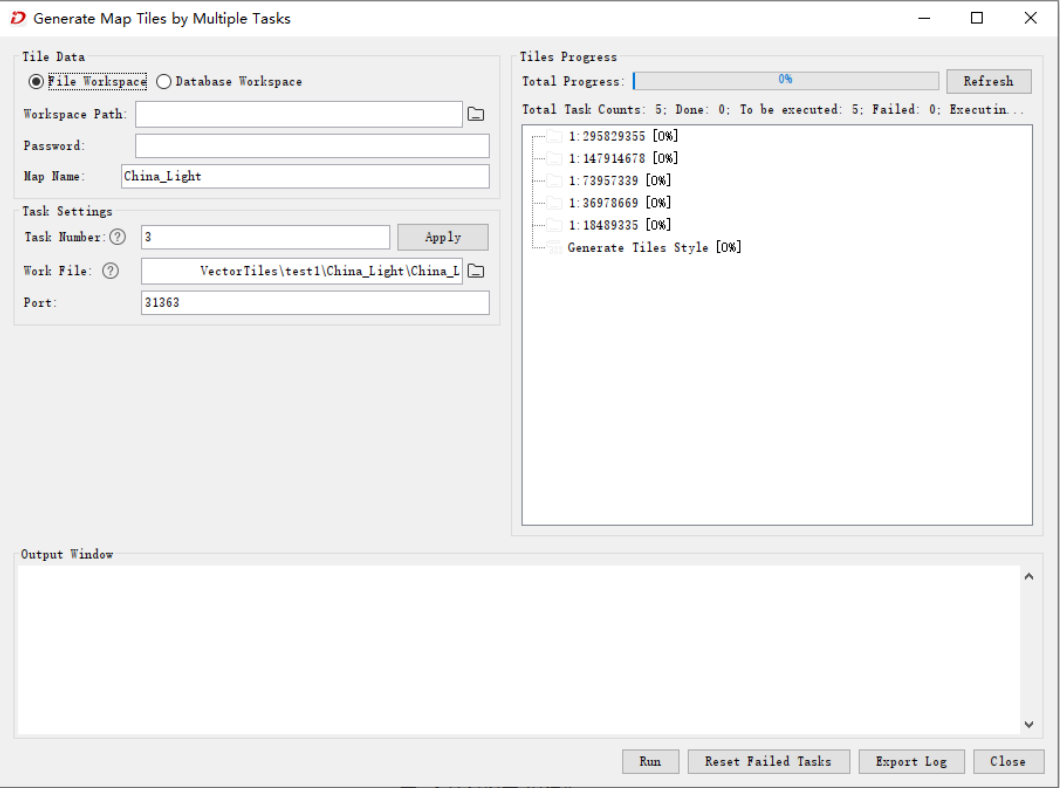
- File Workspace/Database Workspace: select 'File workspace';
When selecting file workspace, you only need to specify the workspace path. When selecting database workspace, you should select the workspace type and enter the database connection information. - Workspace Path: The workspace path where the map to be generate tiles is located;
It is necessary to ensure that the map in this workspace is consistent with the map in tile generating task. If it is not consistent, the result will not be browsed correctly. And in this case, it's recommended to re-split the updated map before cutting. - Map Name: Set the name of the map to be cut.
- Task Number: Keep the default value of 3, which means that the machine has 3 processes to perform the map cutting task by default.
The number of tasks to generate tiles, the number of processes need to be set according to the configuration of the machine and the use of the process. The default number of tasks is the number of CPU threads of the computer * 1.5, and the CPU utilization rate is 100% when generating tiles. The number of tasks can be adjusted at any time in the whole process. Click 'Apply' button to increase or decrease the process that is performing in time. - Work file: Keep the default values here.
To the *.sci file in the folder named tile in the tile working directory. Multi-machine multi-task map is set to the file in the working directory of the host. The working directory of the host must be a shared directory. - Port: Keep default here, the default port number for the host to perform tiles generating is 31363.
It's used to uniquely identify an application process on the host to facilitate communication between different application processes. Specifying port can provide reliable data transmission. If the port is occupied when performing tiles generating, please check the usage of the port and specify another port.
- After setting the above parameters, click Run to generate tiles, and you can view the real-time progress information. In addition, it supports adjusting the priority of generating tasks of a scale, or suspending the task. Select a scale and right-click it, then click 'priority' to move the task forward or click 'stop' to suspend it.
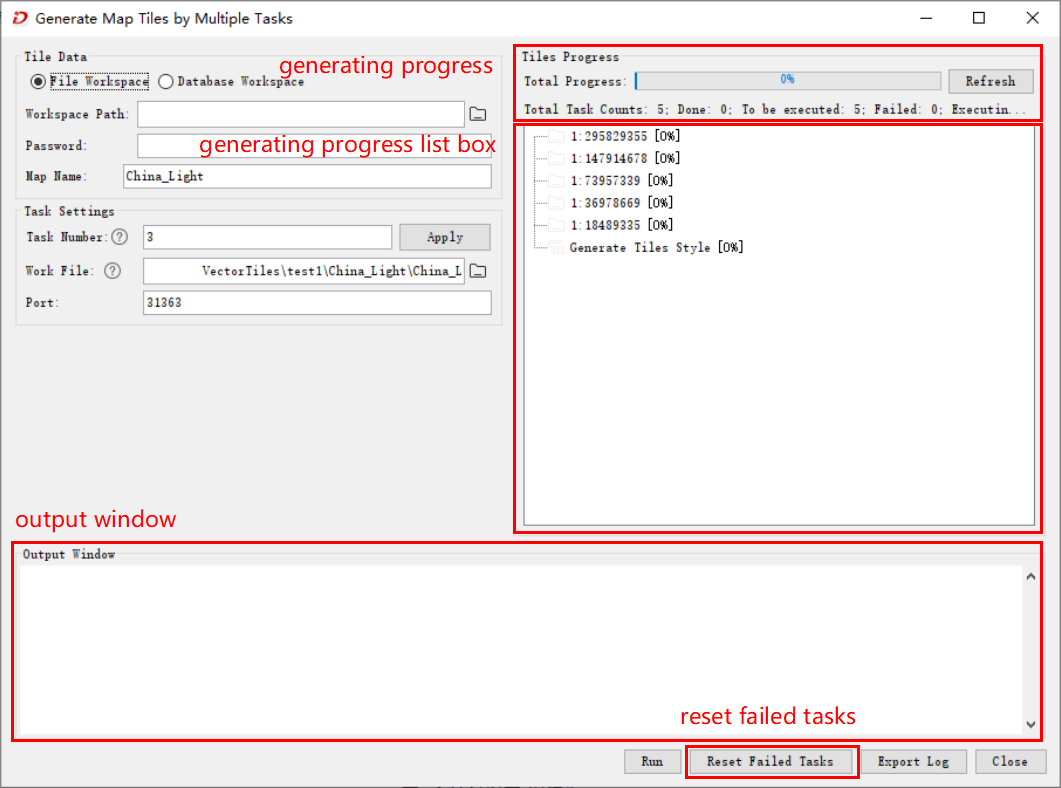
- Generating progress: In the dialog box's right, you can refresh and view the generating progress in real time, including the total task counts, done, to be executed, failed and executing.
- Generating progress list box: you can view progress information of subtasks at each map scale in real time.
- Output Window: The output information in the generating process can be displayed in real time in the lower side of the dialog box.
- Reset failed task: If exists failed tasks, you can reset the failed tasks to re-generate them. If it's still have failed tasks, please further check the map or tasks, and then restart generating.
- Output vector tiles: After tiles generating is complete, it will indicate that the tiles has been generated successfully. Under the output path, the folders and files as shown in below will be produced.
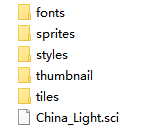
- fonts: font files for vector tiles
- sprites: style resources related to vector tile icons
- styles: vector tile style files
- tiles: Vector tile data (.mvt file)
- *.sci file: The meta-information description file of the vector tile, which records the projection, geographic extent, and hierarchical scale of the data.
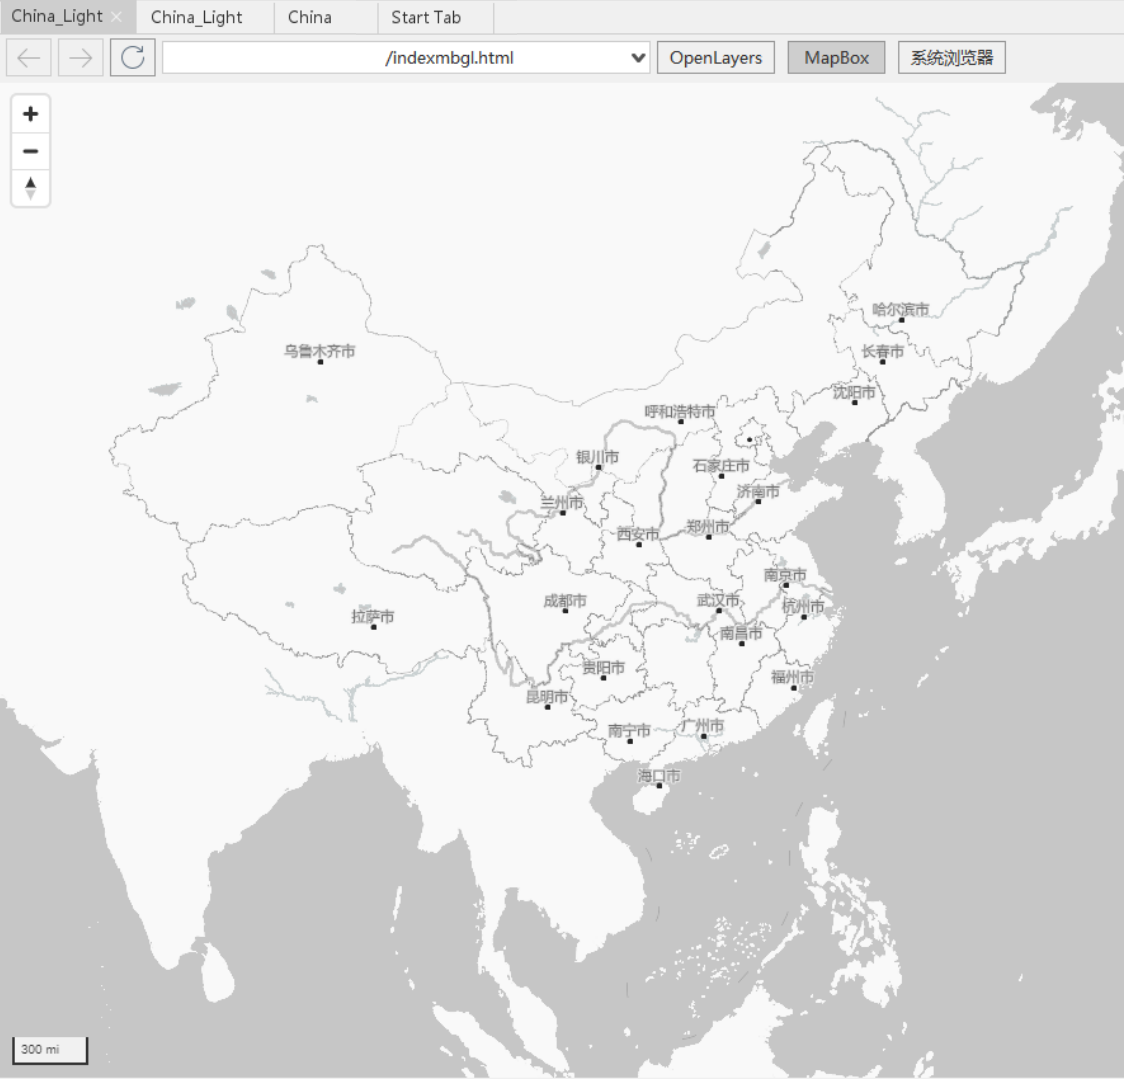
- View vector tiles: In China workspace, right-click Datasources > select Open File Datasource > open the *.sci file in the vector tile results folder, and then double-click to show it in the map window.
# Publish vector tiles in iServer
Startup iServer: run startup.bat (Windows OS) or startup.sh (Linux OS) in the bin directory of iServer to startup it.
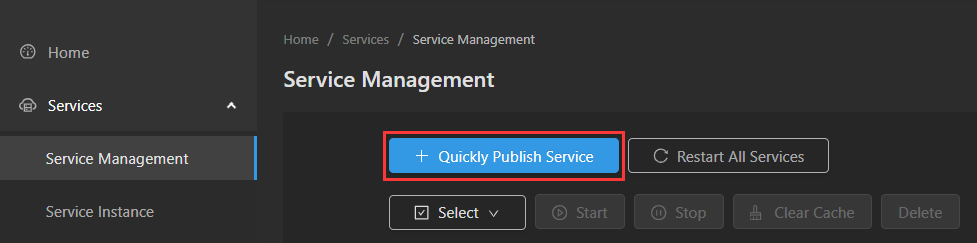
Open a browser, enter the iServer management address(http://<server>: <port>/iServer/admin - UI/services/serviceManagement), log into the administrator account. In the left navigation bar, select Services > Service Management > click Quickly Publish Service in the right page.
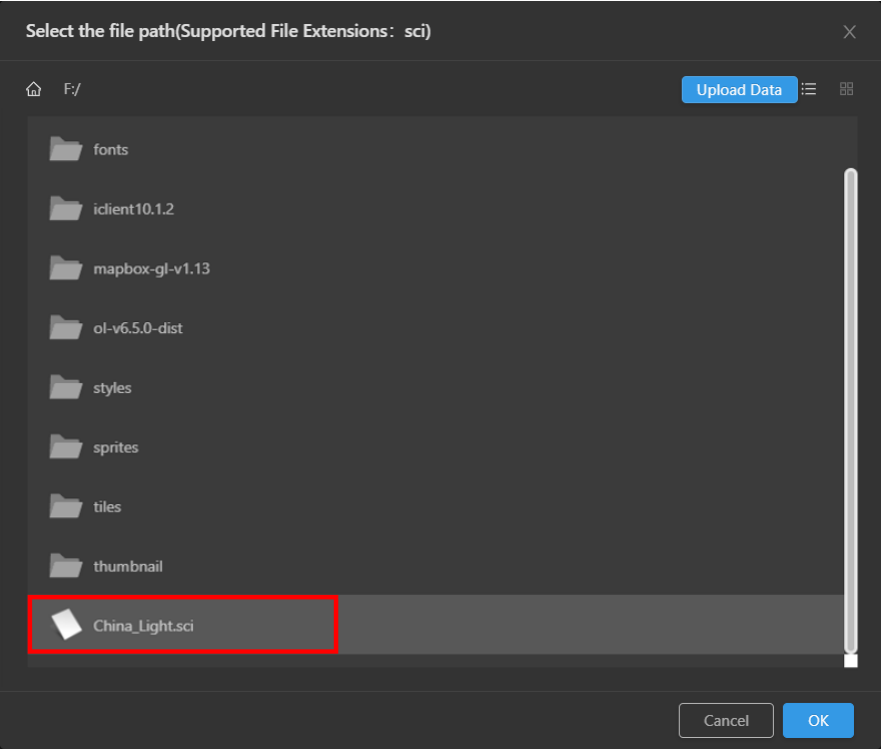
- In Publish services page, select UGCV5(MVT) Tiles as the datasource and click Next to upload the *.sci file generated in Generate Vector tiles in iDesktopX > Step 9 .
- If you are publishing locally produced vector tiles to a locally deployed iServer, you can find the corresponding tile configuration file in the file path. If you are publishing locally produced vector tiles to a iServer deployed on another machine, you can click Upload Data to find and upload the corresponding tile configuration file from your local file path.
- Check the REST Map Service and REST Vector Tile Service, and click Next to configure the service. Because there is no configuration item, click Publish to publish the service direcly.

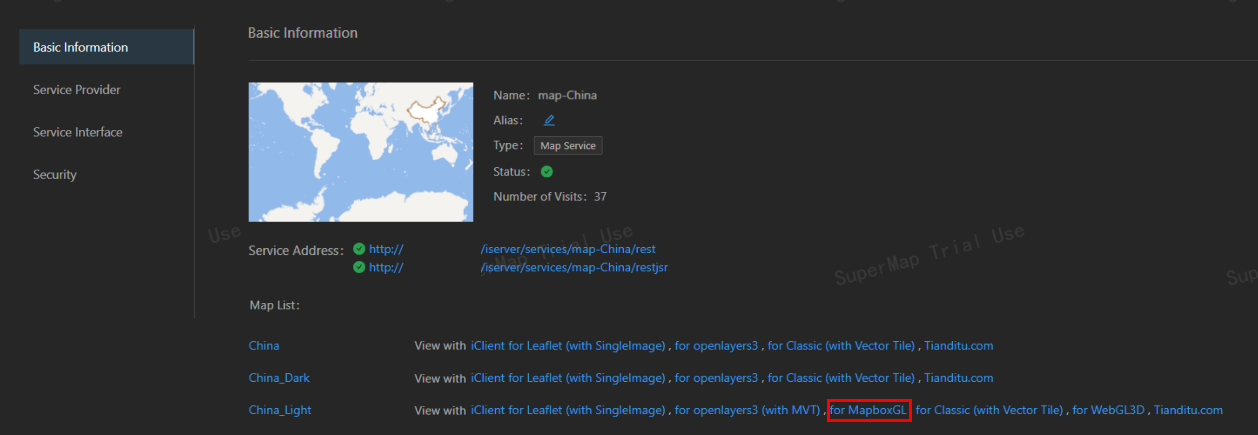
- After the service is published, you can view the service in Service Management page. Click the service in the list, it will display the detailed information of the service.
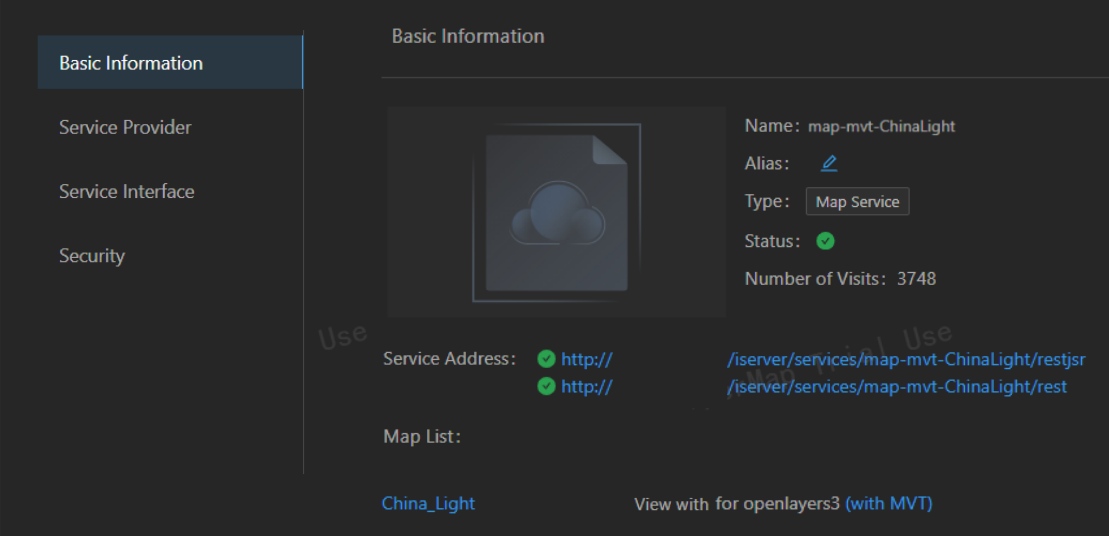
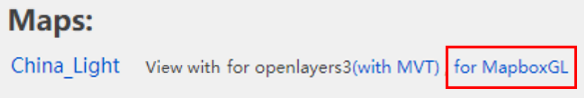
- In Basic Information tab, click service address, then in the popup page, click maps under Next level > select map name > select View with iClient for MapboxGL, then you can preview the map service published using vector tiles.
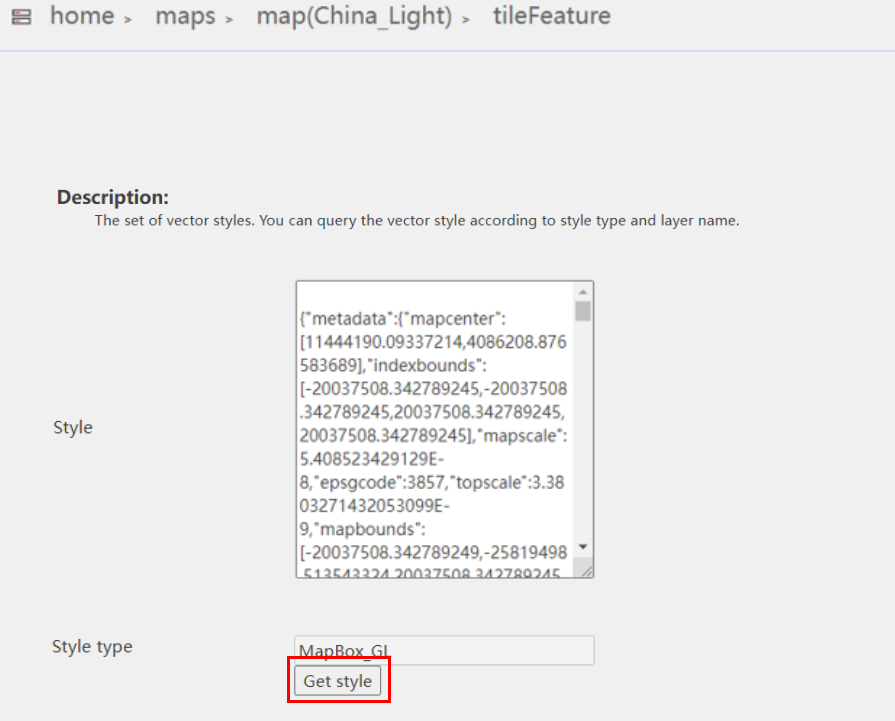
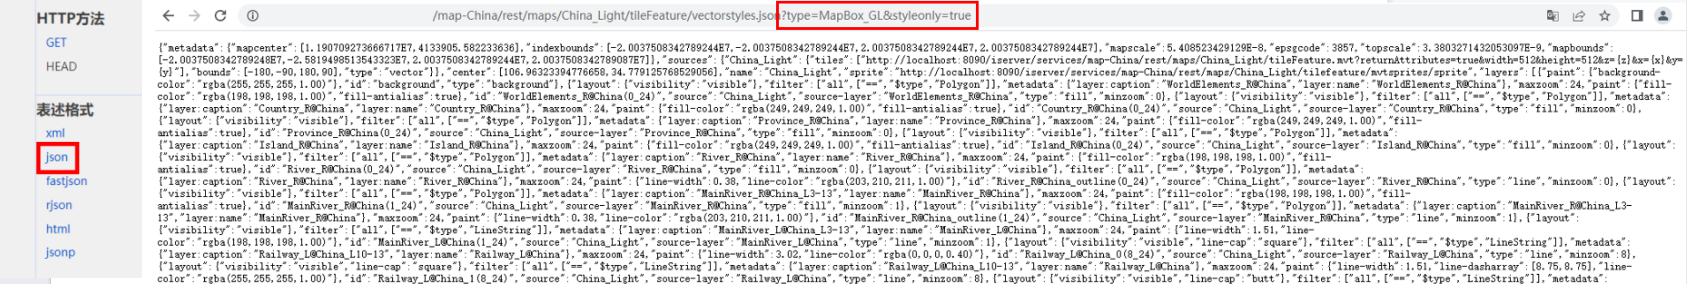
- In Basic Information tab, click the map service under Service Address. In the popup page, click maps under Next Level > click the corresponding map in the list > Click tileFeature under Supported Operations > click vectorStyles under Support Operations > click Get Style button in the vector styles page. Then you can view the vector styles of the map.
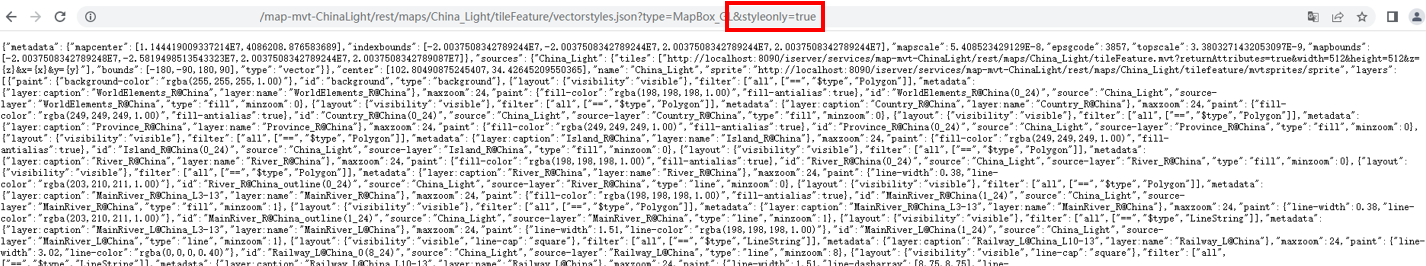
- Select json in Output formats in vector style page, and add
&styleonly=trueto the URI in the top address bar to view the JSON description of the vector style, which contains parameters and properties for loading vector tiles in iClient.
# Generate vector tiles dynamically
Publishing the workspace as map and vector tile service is a necessary step before generating vector tiles dynamically. In this section, we will publish the workspace of the sample map China_Light as a map service in iServer. Before publishing, make sure that the map coordinate system has the correct EPSG code (custom coordinate system is not supported yet) so that you can use the vector tile in iClient later. The steps are as follows:
- Startup iServer: run startup.bat (Windows OS) or startup.sh (Linux OS) in the bin directory of the iServer to startup iServer.
- Open a browser, enter the iServer management address(http://<server>:<port>/iServer/admin-UI/services/serviceManagement), log into the administrator account. In the left navigation bar, select Services > Service Management, then click Quickly Publish Service in the right page.
- Select File workspace as the datasource, click Next > fill in the Workspace Path of sample data China_Light > click Next > check Service type REST Map Service and REST Vector Tile Service > click Next > keep Editable and DPI default > click Publish to publish the workspace as a service.
- Note: When publishing service in iServer, close the workspace to be published in iDesktopX to prevent the workspace from being occupied.

- After the service is published, it can be viewed in the service management page. Click the service and it will display the detailed information. In the Basic Information tab, select the map and view with iClient for MapboxGL to preview the map service.
In the Basic Information tab of the service information page, click the link with the suffix rest in the Service Address > click maps under the Next level in the pop-up page > click the corresponding map in the Map List > click tileFeature under Supported Operations > click vectorStyles under Supported Operations > Select JSON in Output Format on the page's right, and you can view the JSON description of map vector style, which contains the relevant parameters and properties for visualizing vector tiles in iClient.
Add
?type=MapBox_GL&styleonly=trueafter the URI in the address bar, and reload the page to view the JSON description of the MapBoxGL type.
# Viusalize vector tile
In the previous section, we have successfully generated vector tiles and now we can display the tiles in iClient based on the MapBox style file. In this example, we will use SuperMap iClient for MapboxGL to render vector tiles, and the steps are as follows:
- Create a new HTML file and set it like the following basic format:
<html>
  <head>
    <meta charset="UTF-8" />
    <title data-i18n="vectortile - visualization"></title>
  </head>
</html>
- In
<head>tag, import MapboxGL v1 CSS and JS file, and fill in the BootCDN hosting address.
<link href="https://cdnjs.cloudflare.com/ajax/libs/mapbox-gl/1.13.2/mapbox-gl.css" rel="stylesheet" />
<script type="text/javascript" src="https://cdnjs.cloudflare.com/ajax/libs/mapbox-gl/1.13.2/mapbox-gl.js"></script>
- In
<head>tag, import iclient-MapBoxgl CSS and JS file, and add the online site address of SuperMap iClient for MapboxGL.
<link href="https://iclient.supermap.io/dist/mapboxgl/iclient-mapboxgl.min.css" rel="stylesheet" />
<script type="text/javascript" src="https://iclient.supermap.io/dist/mapboxgl/iclient-mapboxgl.js"></script>
- In
<body>tag, add the following code to create a map container.
<div
  id="map"
  style="
        position: absolute;
        left: 0px;
        right: 0px;
        width: 1920px;
        height: 1080px;
      "
></div>
- In
<body>tag, declare map variable map in<script>tag, and the container attribute specifies the map container created in step 3. The center, zoom and other parameters are described in: Map | Mapbox GL JS | Mapbox (opens new window).
- If you are using Pre-generate vector tiles, fill style attribute with the map vector style JSON description address in Pre-generate vector tiles > Publish vector tiles in iServer > Step 8;
- If you are using generate vector tiles dynamically, fill style attribute with the map vector style JSON description address in Generate vector tiles dynamically > Step 6;
var map = new mapboxgl.Map({
  container: 'map', // container id
  style:
    'http://localhost:8090/iserver/services/map-mvt-ZhuanTiTuJingJiFaZhanTongJi/rest/maps/%E4%B8%93%E9%A2%98%E5%9B%BE_%E7%BB%8F%E6%B5%8E%E5%8F%91%E5%B1%95%E7%BB%9F%E8%AE%A1/tileFeature/vectorstyles.json?type=MapBox_GL&styleonly=true',
  center: [104.35375913450572, 31.572093201149855], // starting position
  zoom: 0,
  attributionControl: false
});
- Use
addControl()to add map controls to the map, such as pan and scale controls.
map.addControl(new mapboxgl.NavigationControl(), 'top-left');
map.addControl(new mapboxgl.ScaleControl({}));
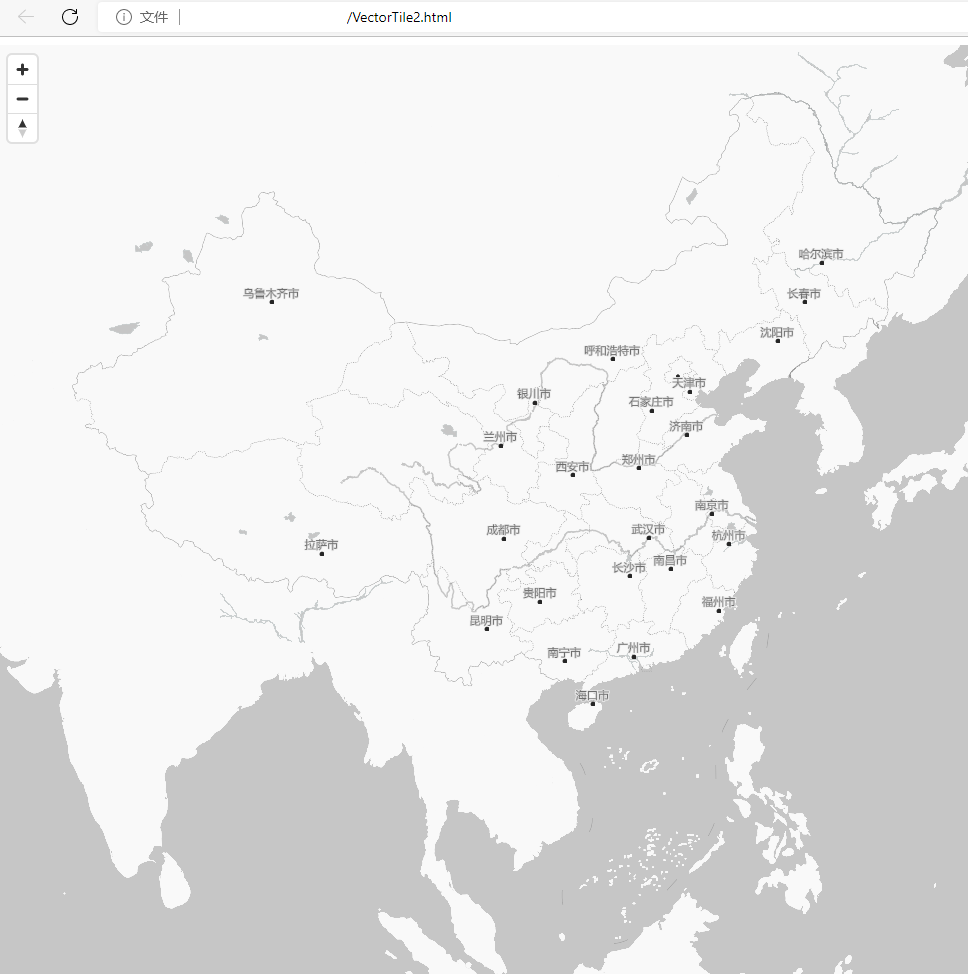
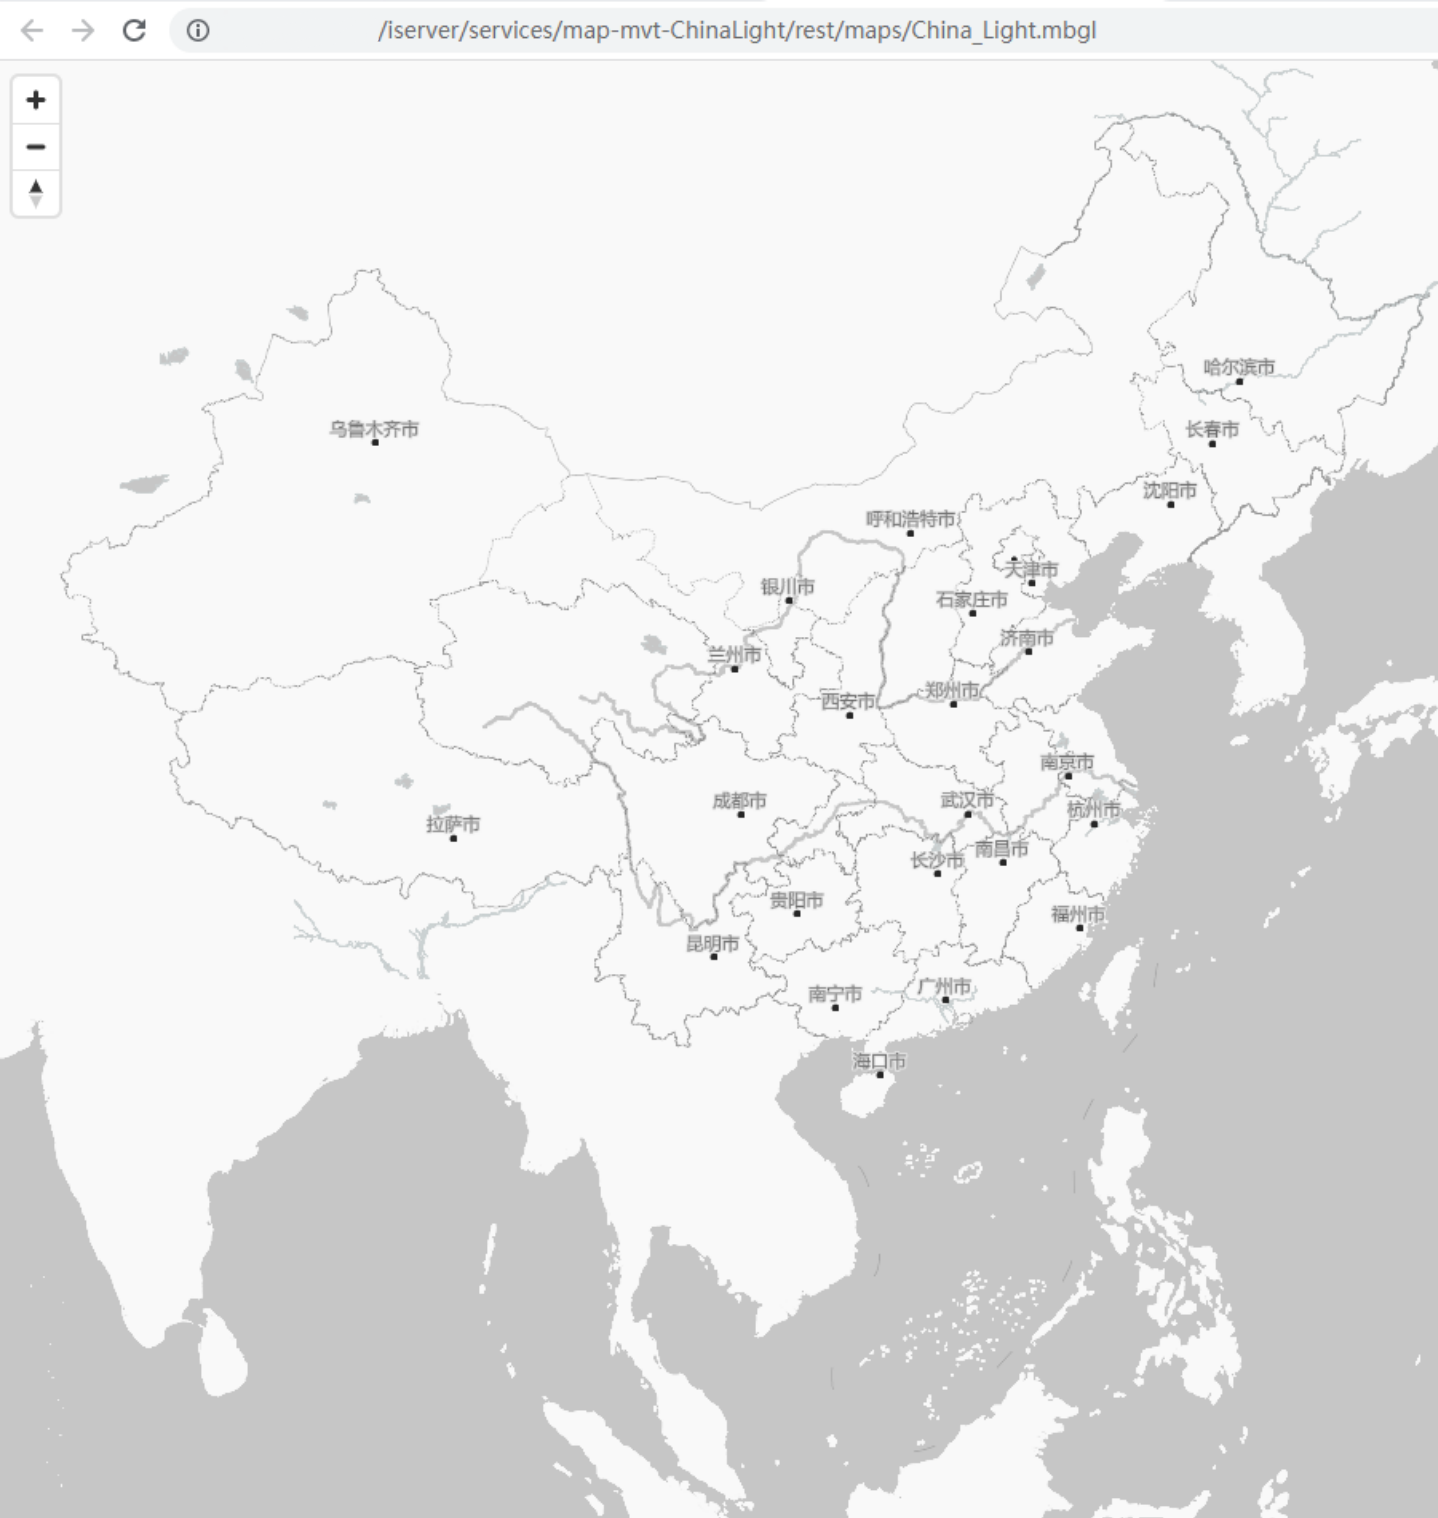
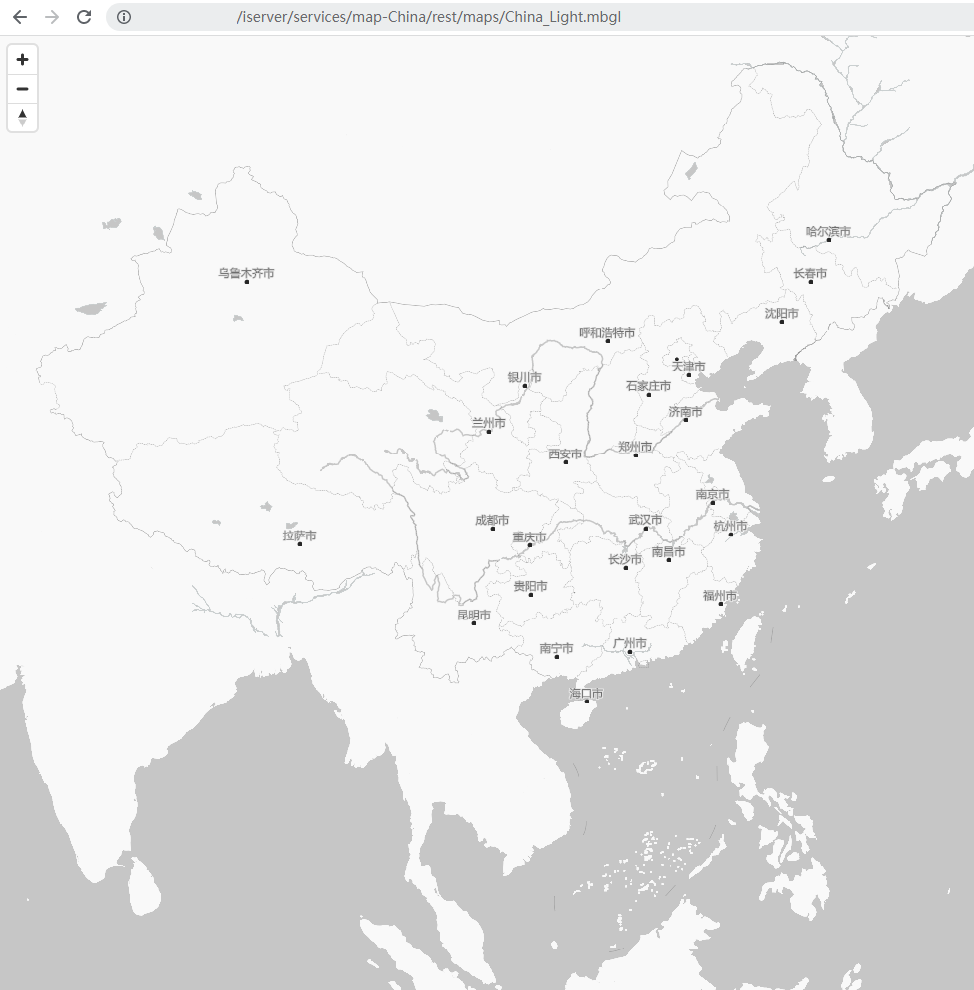
- The complete example code for visualization of vector tiles in iClient is as follows. Save the HTML file and open it in a browser, it will show the following map on the page. View more examples of vector tiles: SuperMap iClient for MapboxGL - examples - Vector tile (opens new window)。
<!DOCTYPE html>
<html lang="en">
  <head>
    <meta charset="UTF-8" />
    <meta http-equiv="X-UA-Compatible" content="IE=edge" />
    <meta name="viewport" content="width=device-width, initial-scale=1.0" />
    <title>UGCV5(MVT)</title>
    <!-- import MapboxGL v1 file and JS file; import iclient-mapboxgl CSS file and JS file-->
    <link href="https://cdnjs.cloudflare.com/ajax/libs/mapbox-gl/1.13.2/mapbox-gl.css" rel="stylesheet" />
    <link href="https://iclient.supermap.io/dist/mapboxgl/iclient-mapboxgl.min.css" rel="stylesheet" />
    <script type="text/javascript" src="https://cdnjs.cloudflare.com/ajax/libs/mapbox-gl/1.13.2/mapbox-gl.js"></script>
    <script type="text/javascript" src="https://iclient.supermap.io/dist/mapboxgl/iclient-mapboxgl.js"></script>
  </head>
  <body>
    <!--  div for displaying map-->
    <div
      id="map"
      style="
        position: absolute;
        left: 0px;
        right: 0px;
        width: 1920px;
        height: 1080px;
      "
    ></div>
    <script type="text/javascript">
      var map = new mapboxgl.Map({
        container: 'map', // container id
        style:
          'http://localhost:8090/iserver/services/map-China/rest/maps/China_Light/tileFeature/vectorstyles.json?type=MapBox_GL&styleonly=true',
        center: [104.35375913450572, 31.572093201149855], // starting position
        zoom: 0, // starting zoom
        attributionControl: false
      });
      map.addControl(new mapboxgl.NavigationControl(), 'top-left');
    </script>
  </body>
</html>