SuperMap iClient for OpenLayers
Getting Started with Development
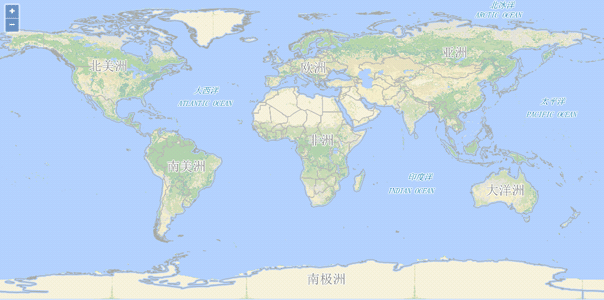
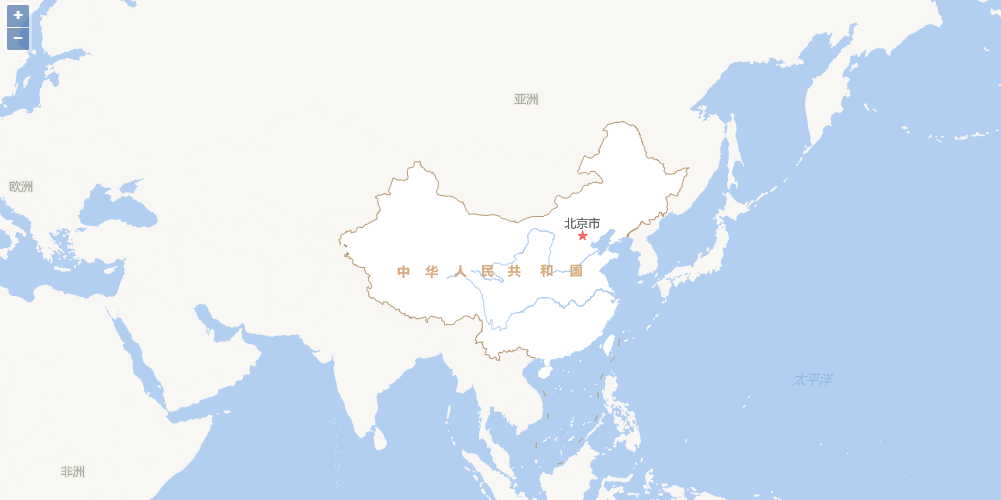
Here we use the World map service published by SuperMap iServer to introduce how to create a simple map application using SuperMap iClient for JavaScript.
Introduce ol.js or ol-debug.js. For OpenLayers, please introduce BootCDN host addresss:
<script type="text/javascript" src="https://cdn.bootcss.com/openlayers/4.2.0/ol.js"></script>Introduce iclient9-openlayers.js or iclient9-openlayers.min.js:
<script type="text/javascript" src="https://iclient.supermap.io/dist/iclient9-openlayers.js"></script>Load services published by iServer to map of OpenLayers:
var map = new ol.Map({
    target: 'map',
    layers: [new ol.layer.Tile({
            source: new ol.source.TileSuperMapRest({
                    url: "http://localhost:8090/iserver/services/map/rest/maps/World"
            }),
     })]
});view source code »
Run Effects
npm
Install
npm install @supermap/iclient-openlayers
ES6 development Example
Example 1 (import partial modules)
                            import ol from 'openlayers';
import {Logo, TileSuperMapRest} from '@supermap/iclient-openlayers';

var url = "https://iserver.supermap.io/iserver/services/map-world/rest/maps/World";
var map = new ol.Map({
    target: 'map',
    controls: ol.control.defaults({attributionOptions: {collapsed: false}})
        .extend([new Logo()]),
    view: new ol.View({
        center: [0, 0],
        zoom: 2,
        projection: 'EPSG:4326'
    })
});
var layer = new ol.layer.Tile({
    source: new TileSuperMapRest({
        url: url,
        wrapX: true
    }),
    projection: 'EPSG:4326'
});
map.addLayer(layer);
Example 2 (import all modules)
                            import ol from 'openlayers';
import '@supermap/iclient-openlayers';

var url = "https://iserver.supermap.io/iserver/services/map-world/rest/maps/World";
var map = new ol.Map({
    target: 'map',
    controls: ol.control.defaults({attributionOptions: {collapsed: false}})
        .extend([new ol.supermap.control.Logo()]),
    view: new ol.View({
        center: [0, 0],
        zoom: 2,
        projection: 'EPSG:4326'
    })
});
var layer = new ol.layer.Tile({
    source: new ol.source.TileSuperMapRest({
        url: url,
        wrapX: true
    }),
    projection: 'EPSG:4326'
});
map.addLayer(layer);
CommonJS development Example
Example 1 (import partial modules)
                            var ol = require('openlayers');
var Logo = require('@supermap/iclient-openlayers').Logo;
var TileSuperMapRest = require('@supermap/iclient-openlayers').TileSuperMapRest;

var url = "https://iserver.supermap.io/iserver/services/map-world/rest/maps/World";
var map = new ol.Map({
    target: 'map',
    controls: ol.control.defaults({attributionOptions: {collapsed: false}})
        .extend([new Logo()]),
    view: new ol.View({
        center: [0, 0],
        zoom: 2,
        projection: 'EPSG:4326'
    })
});
var layer = new ol.layer.Tile({
    source: new TileSuperMapRest({
        url: url,
        wrapX: true
    }),
    projection: 'EPSG:4326'
});
map.addLayer(layer);
Example 2 (import all modules)
                            var ol = require('openlayers');
require('@supermap/iclient-openlayers');

var url = "https://iserver.supermap.io/iserver/services/map-world/rest/maps/World";
var map = new ol.Map({
    target: 'map',
    controls: ol.control.defaults({attributionOptions: {collapsed: false}})
        .extend([new ol.supermap.control.Logo()]),
    view: new ol.View({
        center: [0, 0],
        zoom: 2,
        projection: 'EPSG:4326'
    })
});
var layer = new ol.layer.Tile({
    source: new ol.source.TileSuperMapRest({
        url: url,
        wrapX: true
    }),
    projection: 'EPSG:4326'
});
map.addLayer(layer);
About packing
Because iClient uses ES6, in order to be compatible with browsers that do not support ES6, some configuration needs to be performed during the packaging process, including loading images and CSS files and processing the syntax conversion.
If you use webpack, you need to add the following configuration items in the webpack.config.js.
                            module: {
        rules: [{
            // Load image files, Encoding images Which are less than 80k with base64.
            test: /\.(png|jpg|jpeg|gif|woff|woff2|svg|eot|ttf)$/,
            use: [{
                loader: 'url-loader',
                options: {
                    limit: 80000
                }
            }]
        }, {
            // Load CSS files
            test: /\.css$/,
            use: ['css-loader']
        }, {
            // Use the babel-loader to convert ES6 syntax to ES5.
            test: /\.js$/,
            include: [
                path.resolve(__dirname, "node_modules/@supermap/iclient-common"),
                path.resolve(__dirname, "node_modules/@supermap/iclient-leaflet"),
                path.resolve(__dirname, "node_modules/elasticsearch"),
            ],
            loader: 'babel-loader',
            options: {
                presets: ['es2015']
            }
        }]
    }
Using Map Services
REST map service functions provided by SuperMap iClient for OpenLayers include:
- Map layer: Supports dynamic layer locationing, dynamic layer overlay
- Map control: Map dragging, zooming and panning, feature drawing, cache switching, etc.
- Thematic maps: Unique values map, ranges map, label map, dot density map, graduated symbol map, graph map.
- Query: Distance query, geometric object query, SQL query, bounds query, nautical chart query
- Measure:Distance query and area query
Using REST Map Services
Dynamic Layer Overlay
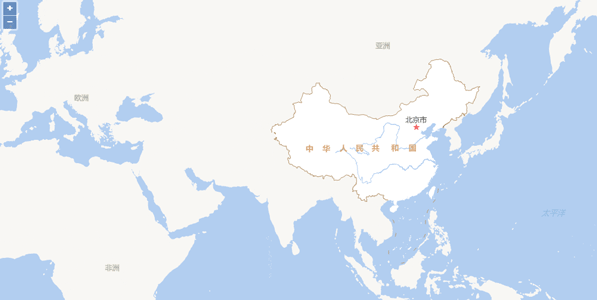
A layer is used to load information on the map for display. For one map, you can add one or multiple layers to realize the effects the client wants. You can use addTo() to add a layer to a map. In this example, we add the map for Beijing and Tianjin area to the World map:
                                var map = new ol.Map({
        target: 'map',
        view: new ol.View({
            center: [116.85, 39.79],
            zoom: 7,
            projection: 'EPSG:4326'
        })
    });
    var worldLayer = new ol.layer.Tile({
        source: new ol.source.TileSuperMapRest({
            url: DemoURL.world
        }),
        projection: 'EPSG:4326'
    });
    map.addLayer(worldLayer);
    var jinJingLayer = new ol.layer.Tile({
        source: new ol.source.TileSuperMapRest({
            url: DemoURL.jingjin_map,
            origin: [-180, 90],
            transparent: true
        }),
        projection: 'EPSG:4326'
    });
    map.addLayer(jinJingLayer);
Run effects
Distance Measurement
1. Construct Servie Parameter Class
The measurement service parameter class provides the information required by the service request, which provides the query parameter encapsulation of the measurement. Parameters provided include geometry and unit, which are used to define the geometric objects and units of the measurement, with the code as follows:
                            var measureParam = new SuperMap.MeasureParameters();
//Set the vector object ({ol.geom.Geometry}),geometry to measure, and geometry can obtain via initialization
measureParam.geometry = geometry;
2. Construct service class and send request
The measurement service class is responsible for sending requests to the server and getting the query results returned. The service class needs to specify service parameters such as URL, send request information to the server, and then request the complete event via the listener service. The results can be obtained from the event service data class, and handled according to the requirements. Please refer to the following code:
                            //Initialize the service class and set service request key parameters
var measureService =new ol.supermap.MeasureService(url);
//Submit service request, pass service query parameters, get returned results and handle the results according to requirements
measureService.measureArea(measureParam, function (serviceResult) {
    function showAlert(serviceResult);
});
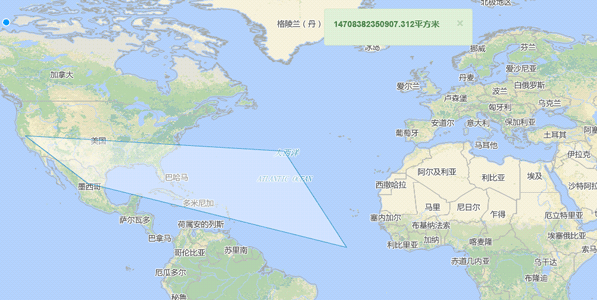
3. Handle results
While handling the service request event, we can obtain the result information and display it, and use the form of the pop up window to show the measurement result:
                            function showAlert(serviceResult) {
    alert(serviceResult.result.area + "square meter")
}
Run effects
Using OGC Map Service
WMS Service
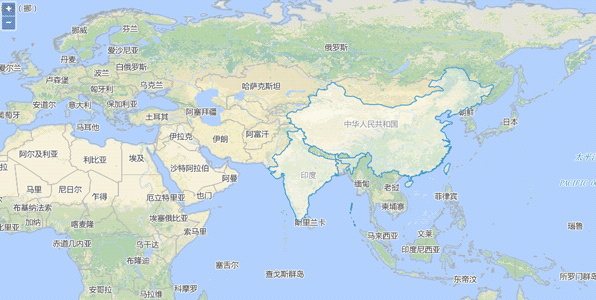
The WMS layer allows you to access layer services based on the OGC WMS Standard, including other third-party WMS services other than those from iServer. WMS Service conforms to WMS Implementation Specification provided by OGC (Open Geospatial Consortium, the Open Geographical Information Alliance), currently including WMS 1.1.1 and 1.3.0.
This section will introduce to you how to add WMS layer to display OGC map service data taking WMS_China published by SuperMap iServer as an example.
                                var resolutions = new Array(17);
    var matrixIds = new Array(17);
    for (var z = 0; z < 17; ++z) {
        resolutions[z] = 156543.033928041 / Math.pow(2, z);
        matrixIds[z] = z;
    }
    var map = new ol.Map({
        target: 'map',
        view: new ol.View({
            center: [0, 0],
            zoom: 0,
        }),
        layers: [new ol.layer.Tile({
            opacity: 0.7,
            source: new ol.source.TileWMS({
                url: 'https://iserver.supermap.io/iserver/services/map-china400/wms111/China',
                params: {
                    'LAYERS': 'China',
                    'FORMAT': 'image/png'
                },
            }),
        })]
    });
Run effects
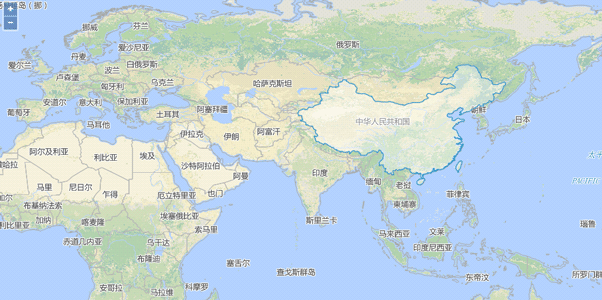
WMTS Service
The WMTS layer allows you to access layer services based on the OGC WMTS 1.0.0 Standard, including other third-party WMS services other than those from iServer. WMTS is first service standard to support rest from OGC. Current version is 1.0.0. Currently, three request modes are supported: HTTP KVP (Key-value Pair) mode, SOAP mode, REST mode. Note: Users need to set various types of parameters for the map request: matrixIds、layer、tilematrixSet、url and so on, where the matrixIds will be different due to the standard of the service and the scale set and needs to be set accordingly.
This section will introduce to you how to add WMTS layer to display OGC map service data taking WMTS_China published by SuperMap iServer as an example.
                                var resolutions = new Array(17);
    var matrixIds = new Array(17);
    for (var z = 0; z < 17; ++z) {
        resolutions[z] = 156543.033928041 / Math.pow(2, z);
        matrixIds[z] = z;
    }
    var map = new ol.Map({
        target: 'map',
        view: new ol.View({
            center: [0, 0],
            zoom: 0,
        }),
        layers: [new ol.layer.Tile({
            opacity: 0.7,
            source: new ol.source.WMTS({
                url: 'https://iserver.supermap.io/iserver/services/map-china400/wmts100',
                layer: 'China',
                matrixSet: 'GoogleMapsCompatible_China',
                format: 'image/png',
                tileGrid: new ol.tilegrid.WMTS({
                    origin: [-2.0037508342787E7, 2.0037508342787E7],
                    resolutions: resolutions,
                    matrixIds: matrixIds
                }),
                style: 'default',
            })
        })]
    });
Run effects
Using Data Services
REST data services supported by SuperMap iClient for OpenLayers include:
- Dataset ID Query
- Dataset Geometry Query
- Dataset Buffer Query
- Dataset SQL Query
- Dataset Editing
Using REST Data Service
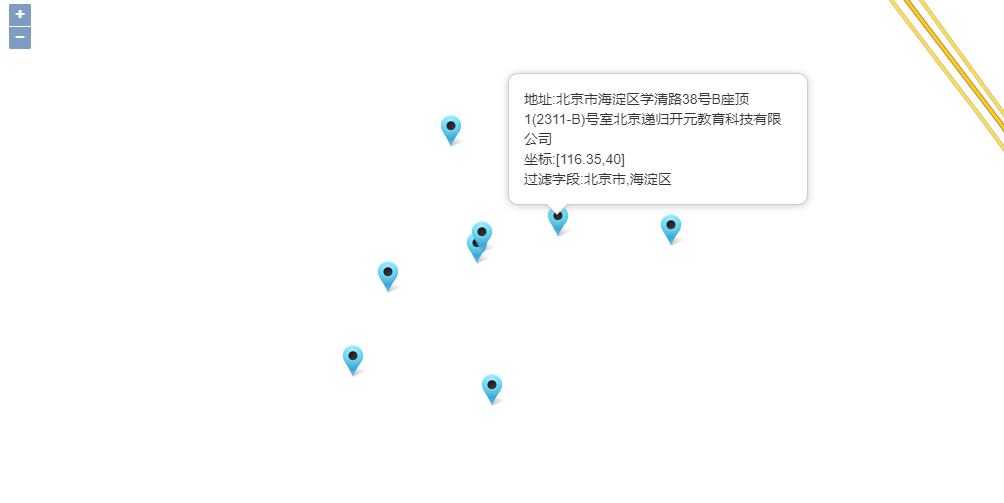
Dataset ID Query
Dataset ID query queries geographic features with specified IDs in a dataset and display the results on the client. This example queries geographic features with specified IDs in the World dataset.
                                var map, resultLayer,
            baseUrl = "https://iserver.supermap.io/iserver/services/map-world/rest/maps/World",
            url = "https://iserver.supermap.io/iserver/services/data-world/rest/data";
    map = new ol.Map({
        target: 'map',
        view: new ol.View({
            center: [100, 0],
            zoom: 3,
            projection: 'EPSG:4326'
        })
    });
    var layer = new ol.layer.Tile({
        source: new ol.source.TileSuperMapRest({
            url: baseUrl
        }),
        projection: 'EPSG:4326'
    });
    map.addLayer(layer);
    query();

    function query() {
        var idsParam = new SuperMap.GetFeaturesByIDsParameters({
            IDs: [246, 247],
            datasetNames: ["World:Countries"]
        });
        new ol.supermap.FeatureService(url).getFeaturesByIDs(idsParam, function (serviceResult) {
            var vectorSource = new ol.source.Vector({
                features: (new ol.format.GeoJSON()).readFeatures(serviceResult.result.features),
                wrapX: false
            });
            resultLayer = new ol.layer.Vector({
                source: vectorSource
            });
            map.addLayer(resultLayer);
        });
    }
Run effects
Dataset SQL Query
Dataset SQL query queries geographic vector features satisfying a specified SQL condition in a dataset and display the results on the client. This example queries geographic features with specified SMID in the World dataset.
                                var map, resultLayer,
            baseUrl = "https://iserver.supermap.io/iserver/services/map-world/rest/maps/World",
            url = "https://iserver.supermap.io/iserver/services/data-world/rest/data";
    map = new ol.Map({
        target: 'map',
        view: new ol.View({
            center: [100, 0],
            zoom: 3,
            projection: 'EPSG:4326'
        })
    });
    var layer = new ol.layer.Tile({
        source: new ol.source.TileSuperMapRest({
            url: baseUrl
        }),
        projection: 'EPSG:4326'
    })
    map.addLayer(layer);
    query();

    function query() {
        var sqlParam = new SuperMap.GetFeaturesBySQLParameters({
            queryParameter: {
                name: "Countries@World",
                attributeFilter: "SMID = 247"
            },
            datasetNames: ["World:Countries"]
        });
        new ol.supermap.FeatureService(url).getFeaturesBySQL(sqlParam, function (serviceResult) {
            var vectorSource = new ol.source.Vector({
                features: (new ol.format.GeoJSON()).readFeatures(serviceResult.result.features),
                wrapX: false
            });
            resultLayer = new ol.layer.Vector({
                source: vectorSource
            });
            map.addLayer(resultLayer);
        });
    }
Run effects
Using Spatial Analyst Services
Spatial analysis functions supported by SuperMap iClient for OpenLayers include:
- Buffer Analysis
- Overlay Analysis
- Surface Analysis
- Dynamic Segmentation
- Route Calculate Measure Services
- Route Locator Point Services
- Route Locator Line Services
Sample: Buffer Analysis
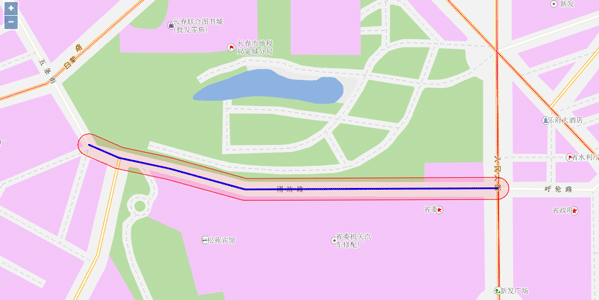
Buffer analysis is an analytical method that automatically establishes a range of regions of a certain width based on the specified distance around the point, line, and polygon features. For example, in environmental governance, a certain width is often drawn around polluted rivers to indicate contaminated areas. At airports, a range of areas are often zoned around a non residential area due to health needs.
Here we create a round buffer with the buffer radius of 10 meters around a road for Changchun data.
Set parameters for buffer analysis
                                var dsBufferAnalystParameters = new SuperMap.DatasetBufferAnalystParameters({
            dataset: "RoadLine2@Changchun",
            filterQueryParameter: new SuperMap.FilterParameter({
                attributeFilter: "NAME='Tuanjie Road'"
            }),
            bufferSetting: new SuperMap.BufferSetting({
                endType: SuperMap.BufferEndType.ROUND,
                leftDistance: {value: 10},
                rightDistance: {value: 10},
                semicircleLineSegment: 10
            })
        });
Set the buffer analysis service object, which is used to pass parameters specified at the cient side to the server side and receive the data from returned from the server. When a request has been sent to the server and the server has returned the result successfully, the user can handle the results of buffer analysis from the server.
                                new ol.supermap.SpatialAnalystService(serviceUrl).bufferAnalysis(dsBufferAnalystParameters, function (serviceResult) {
            var vectorSource = new ol.source.Vector({
                features: (new ol.format.GeoJSON()).readFeatures(serviceResult.result.recordset.features)
            });
            var resultLayer = new ol.layer.Vector({
                source: vectorSource,
                style: new ol.style.Style({
                    stroke: new ol.style.Stroke({
                        color: 'red',
                        width: 1
                    }),
                    fill: new ol.style.Fill({
                        color: 'rgba(255, 0, 0, 0.1)'
                    })
                })
            });
            map.addLayer(resultLayer);
        });
Run effects
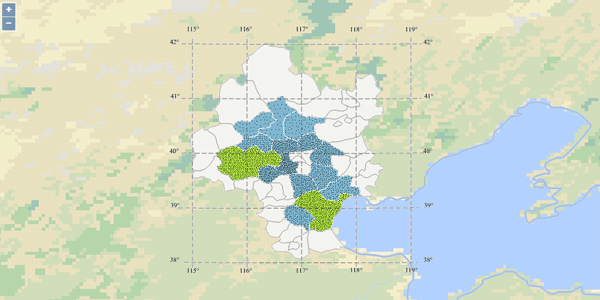
Sample: Overlay Analysis
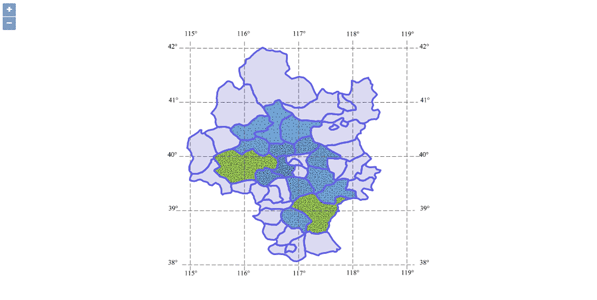
Overlay analysis is a very important spatial analysis function in GIS. It refers to the process of generating new datasets through a series of set operations on two data sets under the unified spatial Reference system, which aims to extract the new spatial geometry information needed by the user via processing or analyzing spatial data. At the same time, the various attribute information of the data will be processed by the overlay analysis.
At present, overlay analysis is widely used in resource management, urban construction assessment, land management, agriculture, forestry, animal husbandry, statistics and other fields. The role of overlay analysis in various fields:
- Resource management is mainly used in the fields of agriculture and forestry to solve the problems of distribution, change and statistics of various resources.
- Urban construction assessment should be used to analyze the development and change of urban population, economy and construction, and the trend and law of the change.
- Land and cadastre management involves the change of land use nature, the change of plot boundary and the change of cadastral ownership, which can be accomplished efficiently with high quality under the help of GIS overlay analysis.
- Ecological and environmental management evaluation is used for regional ecological planning evaluation, environmental status assessment, environmental impact assessment, pollutant reduction and allocation of decision-making support, etc.
- Geoscience research and application is used for topographic analysis, watershed analysis, land use research, economic geography research, spatial statistical analysis, cartography, etc.
Here we overlay the administrative boundary of Beijing and Tianjin area and that of neighboring areas.
Set overlay analysis parameters
                                var datasetOverlayAnalystParameters = new SuperMap.DatasetOverlayAnalystParameters({
            sourceDataset: "BaseMap_R@Jingjin",
            operateDataset: "Neighbor_R@Jingjin",
            tolerance: 0,
            operation: SuperMap.OverlayOperationType.UNION
        });
Set the overlay analysis service object, which is used to pass parameters specified at the cient side to the server side and receive the data from returned from the server. When a request has been sent to the server and the server has returned the result successfully, the user can handle the results of overlay analysis from the server.
                                new ol.supermap.SpatialAnalystService(serviceUrl).overlayAnalysis(datasetOverlayAnalystParameters, function (serviceResult) {
            var resultLayer = new ol.layer.Vector({
                source: new ol.source.Vector({
                    features: (new ol.format.GeoJSON()).readFeatures(serviceResult.result.recordset.features)
                }),
                style: new ol.style.Style({
                    stroke: new ol.style.Stroke({
                        color: 'rgba(100, 100, 225, 10)',
                        width: 3
                    }),
                    fill: new ol.style.Fill({
                        color: 'rgba(0, 0, 255, 0.1)'
                    })
                })
            });
            map.addLayer(resultLayer);
        });
Run effects
Sample: Surface Analysis
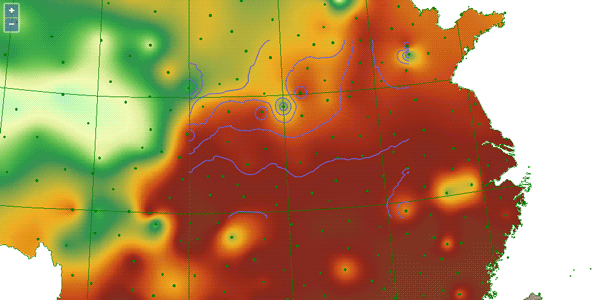
Surface analysis refers to mining the hidden information contained in the original data by analyzing datasets or geometric objects. Surface analysis includes extracting isolines and extracting isoregions. Isolines are lines connected with adjacent points with same values, commonly used for contour lines for height, depth, temperature, precipitation, etc. The distribution of isolines reflects the change of the value on the grid surface, and the denser the contour lines are, the more drastic the change of the grid surface values. At places where the contour distribution is sparse, the change of grid surface values is smaller. By extracting isolines, we can find places where the elevation, temperature or precipitation is the same. Meanwhile, the distribution of isolines can also reflect where the value change is steep or gentle. The isoregions is composed by closing adjacent contour lines. The change of the isoregions can intuitively indicate the change between adjacent isolines, such as elevation, precipitation, temperature or atmospheric pressure. Places where the elevation, precipitation or temperature is equivalent can be obtained by extracting the isoregions.
This section will introduce how to extract contour lines based on temperature resample points of China.
Set surface analysis parameters
                                function surfaceAnalystProcess() {
        //Set surface analysis parameters
        var region = new ol.geom.Polygon([[
            [0, 4010338],
            [1063524, 4010338],
            [1063524, 3150322],
            [0, 3150322]
        ]]);
        var surfaceAnalystParameters = new SuperMap.DatasetSurfaceAnalystParameters({
            extractParameter: new SuperMap.SurfaceAnalystParametersSetting({
                datumValue: 0,
                interval: 2,
                resampleTolerance: 0,
                smoothMethod: SuperMap.SmoothMethod.BSPLINE,
                smoothness: 3,
                clipRegion: region
            }),
            dataset: "SamplesP@Interpolation",
            resolution: 3000,
            zValueFieldName: "AVG_TMP"
        });
Set the surface analysis service object, which is used to pass parameters specified at the cient side to the server side and receive the data from returned from the server. When a request has been sent to the server and the server has returned the result successfully, the user can handle the results of surface analysis from the server.
                                    //Create surface analysis service instance
        var surfaceAnalystService = new ol.supermap.SpatialAnalystService(serviceUrl);
        surfaceAnalystService.surfaceAnalysis(surfaceAnalystParameters, function (surfaceAnalystServiceResult) {
            var result = surfaceAnalystServiceResult.result;
            if (result && result.recordset && result.recordset.features) {
                var resultLayer = new ol.layer.Vector({
                    source: new ol.source.Vector({
                        features: (new ol.format.GeoJSON()).readFeatures(result.recordset.features)
                    }),
                    style: new ol.style.Style({
                        stroke: new ol.style.Stroke({
                            color: 'rgba(100, 100, 225, 10)',
                            width: 1.5
                        }),
                        fill: new ol.style.Fill({
                            color: 'rgba(0, 0, 255, 0.1)'
                        })
                    })
                });
                map.addLayer(resultLayer);
            }
        });
Run effects
Sample: Dynamic Segmentation
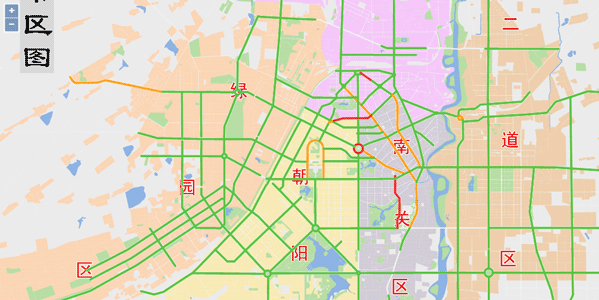
Dynamic segmentation is developed on linear reference. It employs two data structures: route dataset and event table dataset. In real practise, many geographic positions are recorded as the events of features along the line. For example, we tell you that an accident happened in 500m west to the No. 32 corner. Sometimes, over-accurate figures are useless for us in our daily life. However, the relative positions points or lines can help us get the information we want at ease. Linear reference can associate each part of the linear feature to different attribute values under the conditions of not splitting the linear feature into sections. The thought of linear reference can be applied in linear data collection like roads, railways, rivers, etc., public transportation system management, road quality management as well as communication and distribution networks (such as power grids, telephone lines, TV cables, water supply and drainage pipes, etc.).
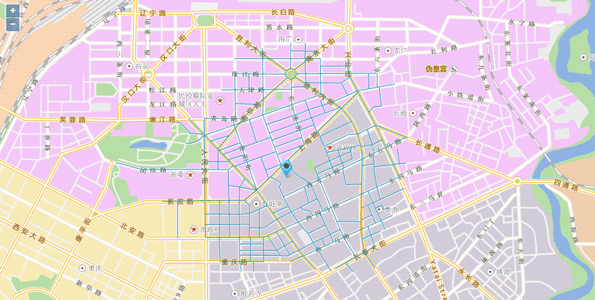
This section introduces to you how to show the road traffic (blocked/congested/expedite) in real-time on the client side based on dynamic segmentation technology to prompt motorists to avoid entering the congested road and choose the appropriate route using data for Changchun city road map as the sample data.
Set parameters including DataReturnOption and generateSpatialDataParams for dynamic segmentation on the client side.
                            //Configure dynamic segmentation parameters
        var generateSpatialDataParameters = new SuperMap.GenerateSpatialDataParameters({
            routeTable: "RouteDT_road@Changchun",
            routeIDField: "RouteID",
            eventTable: "LinearEventTabDT@Changchun",
            eventRouteIDField: "RouteID",
            measureField: "",
            measureStartField: "LineMeasureFrom",
            measureEndField: "LineMeasureTo",
            measureOffsetField: "",
            errorInfoField: "",
            dataReturnOption: new SuperMap.DataReturnOption({
                expectCount: 1000,
                dataset: "generateSpatialData@Changchun",
                deleteExistResultDataset: true,
                dataReturnMode: SuperMap.DataReturnMode.DATASET_ONLY
            })
        });
Set the dynamic segmentation service object, which is used to pass parameters specified at the cient side to the server side and receive the data from returned from the server. When a request has been sent to the server and the server has returned the result successfully, the user can handle the results of dynamic segmentation from the server.
                                    new ol.supermap.SpatialAnalystService(serviceUrl).generateSpatialData(generateSpatialDataParameters, function (serviceResult) {
            var a = serviceResult.result;
            //Display the results on the client side as thematic map
            showAnalysisResult_ThemeGridUnique();
        });

        //Construct thematic map
        function showAnalysisResult_ThemeGridUnique() {
            //Configure thematic map styles
            var style1, style2, style3;
            style1 = new SuperMap.ServerStyle({
                fillForeColor: new SuperMap.ServerColor(242, 48, 48),
                lineColor: new SuperMap.ServerColor(242, 48, 48),
                lineWidth: 1
            });
            style2 = new SuperMap.ServerStyle({
                fillForeColor: new SuperMap.ServerColor(255, 159, 25),
                lineColor: new SuperMap.ServerColor(255, 159, 25),
                lineWidth: 1
            });
            style3 = new SuperMap.ServerStyle({
                fillForeColor: new SuperMap.ServerColor(91, 195, 69),
                lineColor: new SuperMap.ServerColor(91, 195, 69),
                lineWidth: 1
            });
        //Configure thematic map items
            var themeUniqueIteme1, themeUniqueIteme2, themeUniqueIteme3;
            themeUniqueIteme1 = new SuperMap.ThemeUniqueItem({
            unique: "Blocked",
                style: style1
            });
            themeUniqueIteme2 = new SuperMap.ThemeUniqueItem({
            unique: "Congested",
                style: style2
            });
            themeUniqueIteme3 = new SuperMap.ThemeUniqueItem({
            unique: "Expedite",
                style: style3
            });
            var themeUnique = new SuperMap.ThemeUnique({
                uniqueExpression: "TrafficStatus",
                defaultStyle: new SuperMap.ServerStyle({
                    fillForeColor: new SuperMap.ServerColor(48, 89, 14),
                    lineColor: new SuperMap.ServerColor(48, 89, 14)
                }),
                items: [themeUniqueIteme1, themeUniqueIteme2, themeUniqueIteme3]
            });
            var themeParameters = new SuperMap.ThemeParameters({
                themes: [themeUnique],
                datasetNames: ["generateSpatialData"],
                dataSourceNames: ["Changchun"]
            });
            new ol.supermap.ThemeService(baseUrl).getThemeInfo(themeParameters, function (serviceResult) {
                var result = serviceResult.result;
                if (result && result.newResourceID) {
                    var themeLayer = new ol.layer.Tile({
                        source: new ol.source.TileSuperMapRest({
                            url: baseUrl,
                            noWrap: true,
                            cacheEnabled: false,
                            transparent: true,
                            layersID: result.newResourceID,
                            tileGrid: new ol.tilegrid.TileGrid({
                                extent: extent,
                                resolutions: options.tileGrid.getResolutions()
                            }),
                            transparent: true
                        })
                    });
                    map.addLayer(themeLayer);
                }
            })
        }
Run effects
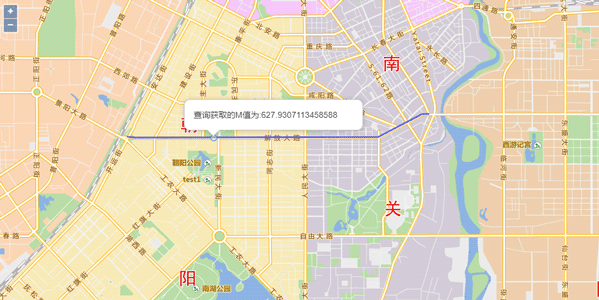
Sample: Route Calculate Measure Services
Route Calculate Measure calculates the M-value of a point to the starting point of the route. For example, a user may want to know where an accident occurred to determine the distance of the point from a certain intersection.
Here we calculate the distance from an accident point to the road intersection (route ID 1690). The sample data used is Changchun data.
Interface usage for Route Calculate Measure Service is as follows:
You need to first initialize the map before the Route Calculate Measure operation.
                                var map,baseUrl = "https://iserver.supermap.io/iserver/services/map-changchun/rest/maps/ChangchunCityMap",
            serviceUrl = "https://iserver.supermap.io/iserver/services/spatialanalyst-changchun/restjsr/spatialanalyst";
    var container = document.getElementById('popup');
    var content = document.getElementById('popup-content');
    var overlay = new ol.Overlay(({
        element: container,
        autoPan: true,
        autoPanAnimation: {
            duration: 250
        }
    }));
    var extent = [48.4, -7668.25, 8958.85, -55.58];
    var projection = new ol.proj.Projection({
        extent: extent,
        units: 'm'
    });
    var mapService = new ol.supermap.MapService(baseUrl);
    mapService.getMapInfo(function (serviceResult) {
        var mapJSONObj = serviceResult.result;
        map = new ol.Map({
            target: 'map',
            view: new ol.View({
                center: [4503.62, -3861.91],
                zoom: 2,
                extent: extent,
                projection: projection
            }),
            overlays: [overlay]
        });
        var options = ol.source.TileSuperMapRest.optionsFromMapJSON(baseUrl, mapJSONObj);
        var layer = new ol.layer.Tile({
            source: new ol.source.TileSuperMapRest(options)
        });
        map.addLayer(layer);
        routeCalculateMeasureProcess();
    });
After the map loading is completed, we will perform the Route Calculate Measure operation. First, we need to get the route object according to the RouteID, and then proceed to subsequent operation.
                                function routeCalculateMeasureProcess() {
        //Establish route via SQL query and add it to the map
        var queryBySQLService = new ol.supermap.QueryService(baseUrl);
        var queryBySQLParams = new SuperMap.QueryBySQLParameters({
            queryParams: [
                new SuperMap.FilterParameter({
                    name: "RouteDT_road@Changchun",
                    attributeFilter: "RouteID=1690"
                })
            ]
        });
        queryBySQLService.queryBySQL(queryBySQLParams, function (SQLQueryServiceResult) {
            var queryBySQLResult = SQLQueryServiceResult.result.recordsets[0].features;
            var pathSource = new ol.source.Vector({
                features: (new ol.format.GeoJSON()).readFeatures(queryBySQLResult)
            });
            var pathLayer = new ol.layer.Vector({
                source: pathSource,
                style: new ol.style.Style({
                    stroke: new ol.style.Stroke({
                        color: 'rgba(100, 100, 225, 10)',
                        width: 3
                    })
                })
            });
            map.addLayer(pathLayer);

            //Extract the points that form the route to construct the parameter sourceRoute
            var pointsList = [];
            var routeObj = queryBySQLResult.features[0].geometry.coordinates[0];
            for (var i = 0; i < routeObj.length; i++) {
                pointsList.push([routeObj[i][0], routeObj[i][1],routeObj[i][2]])
            }
            var routeLine = new ol.geom.LineString([pointsList]);

            //Select one query point (the 8th point in the array) from the points that compose the route and add it to the map
            var point = new ol.geom.Point([routeObj[7][0], routeObj[7][1]]);

            //Create routeCalculateMeasureService
            var routeCalculateMeasureService = new ol.supermap.SpatialAnalystService(serviceUrl);
            var routeCalculateMeasureParameters = new SuperMap.RouteCalculateMeasureParameters({
                "sourceRoute": routeLine,   //Required, route type
                "point": point,            //Required
                "tolerance": 10,
                "isIgnoreGap": false
            });
            routeCalculateMeasureService.routeCalculateMeasure(routeCalculateMeasureParameters, function (routeCaculateServiceResult) {
                var vectorSource = new ol.source.Vector({
                    features: [new ol.Feature(point)],
                });
                var resultLayer = new ol.layer.Vector({
                    source: vectorSource
                });
                map.addLayer(resultLayer);
                var innerHTML = "The M value obtained is: " + routeCaculateServiceResult.result.measure;
                content.innerHTML = innerHTML;
                overlay.setPosition([point.getCoordinates()[0],point.getCoordinates()[1]]);
            });
        });
    }
Run effects
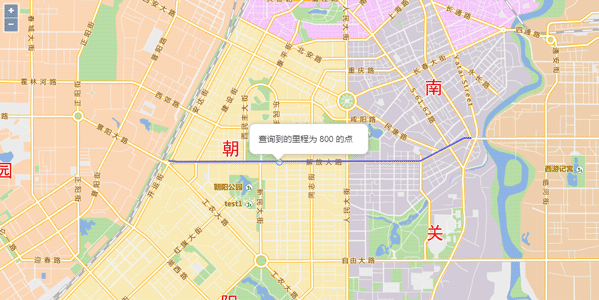
Sample: Route Locator Point Services
Route Locator Point determines the point according to the M value. The application scenario is opposite to Route Calculate Measure. It will be used to determine the precise coordinates of an accidient position when we already know the M value from the point to the raod intersection.
Here we will determine the precise coordinates of an accidient position when we already know the M value from the point to the raod intersection is 10 KM on the route with the ID of 1690. The sample data used here is Changchun data.
You need to first initialize the map before the Route Locator Point operation.
                             var map,baseUrl = "https://iserver.supermap.io/iserver/services/map-changchun/rest/maps/ChangchunCityMap",
            serviceUrl = "https://iserver.supermap.io/iserver/services/spatialanalyst-changchun/restjsr/spatialanalyst";
    var extent = [48.4, -7668.25, 8958.85, -55.58];
    var projection = new ol.proj.Projection({
        extent: extent,
        units: 'm'
    });
    var container = document.getElementById('popup');
    var content = document.getElementById('popup-content');
    var overlay = new ol.Overlay(({
        element: container,
        autoPan: true,
        autoPanAnimation: {
            duration: 250
        }
    }));
    var mapService = new ol.supermap.MapService(baseUrl);
    mapService.getMapInfo(function (serviceResult) {
        var mapJSONObj = serviceResult.result;
        map = new ol.Map({
            target: 'map',
            view: new ol.View({
                center: [4503.62, -3861.91],
                zoom: 2,
                projection: projection
            }),
            overlays: [overlay]
        });
        var options = ol.source.TileSuperMapRest.optionsFromMapJSON(baseUrl, mapJSONObj);
        var layer = new ol.layer.Tile({
            source: new ol.source.TileSuperMapRest(options)
        });
        map.addLayer(layer);
        routeLocatorProcess_point();
    });
After the map loading is completed, we will perform the Route Locator Point operation. First, we need to get the route object according to the RouteID, and then proceed to subsequent operation.
                                function routeLocatorProcess_point() {
        //Establish route by SQL query and add it to the map
        var queryBySQLService = new ol.supermap.QueryService(baseUrl);
        var queryBySQLParams = new SuperMap.QueryBySQLParameters({
            queryParams: [
                new SuperMap.FilterParameter({
                    name: "RouteDT_road@Changchun",
                    attributeFilter: "RouteID=1690"
                })
            ]
        });
        queryBySQLService.queryBySQL(queryBySQLParams, function (SQLQueryServiceResult) {
            var queryBySQLResult = SQLQueryServiceResult.result.recordsets[0].features;
            var pathSource = new ol.source.Vector({
                features: (new ol.format.GeoJSON()).readFeatures(queryBySQLResult)
            });
            var pathLayer = new ol.layer.Vector({
                source: pathSource,
                style: new ol.style.Style({
                    stroke: new ol.style.Stroke({
                        color: 'rgba(100, 100, 225, 10)',
                        width: 3
                    })
                })
            });
            map.addLayer(pathLayer);

            //Extract the points that form the route to construct polyline of sourceRoute
            var pointsList = [];
            var routeObj = queryBySQLResult.features[0].geometry.coordinates[0];
            for (var i = 0; i < routeObj.length; i++) {
                pointsList.push([routeObj[i][0], routeObj[i][1], routeObj[i][2]])
            }
            var routeLine = new ol.geom.LineString([pointsList]);

            //routeLocatorService
            var routeLocatorService = new ol.supermap.SpatialAnalystService(serviceUrl);
            var routeLocatorParameters_point = new SuperMap.RouteLocatorParameters({
                "sourceRoute": routeLine,
                "type": "POINT",
                "measure": 800,
                "offset": 0,
                "isIgnoreGap": true
            });
            routeLocatorService.routeLocate(routeLocatorParameters_point, function (routeLocateServiceResult) {
                var vectorSource = new ol.source.Vector({
                    features: [(new ol.format.GeoJSON()).readFeature(routeLocateServiceResult.result.resultGeometry)],
                    wrapX: false
                });
                var resultLayer = new ol.layer.Vector({
                    source: vectorSource,
                });
                map.addLayer(resultLayer);
                var innerHTML = "Point with M value "+routeLocatorParameters_point.measure+" found";
                content.innerHTML = innerHTML;
                overlay.setPosition([routeLocateServiceResult.result.resultGeometry.geometry.coordinates[0],routeLocateServiceResult.result.resultGeometry.geometry.coordinates[1]]);
            });
        });
    }
Run effects
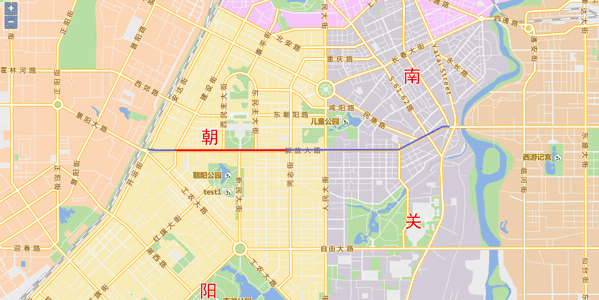
Sample: Route Locator Line Services
Route Locator Line determines the line object on the route according to the specified range. For example, you need to know the precise position of a line segment when we know there is a line segment blocked.
Here we introduce how to determine precise position of a line segment if we already know the measure values of the line segment to the road intersection are 10km to 800km.
You need to first initialize the map before the Route Locator Line operation.
                                var map, baseUrl = "https://iserver.supermap.io/iserver/services/map-changchun/rest/maps/ChangchunCityMap",
            serviceUrl = "https://iserver.supermap.io/iserver/services/spatialanalyst-changchun/restjsr/spatialanalyst";
    var extent = [48.4, -7668.25, 8958.85, -55.58];
    var projection = new ol.proj.Projection({
        extent: extent,
        units: 'm'
    });
    var mapService = new ol.supermap.MapService(baseUrl);
    mapService.getMapInfo(function (serviceResult) {
        var mapJSONObj = serviceResult.result;
        map = new ol.Map({
            target: 'map',
            view: new ol.View({
                center: [4503.62, -3861.91],
                zoom: 2,
                projection: projection
            })
        });
        var options = ol.source.TileSuperMapRest.optionsFromMapJSON(baseUrl, mapJSONObj);
        var layer = new ol.layer.Tile({
            source: new ol.source.TileSuperMapRest(options)
        });
        map.addLayer(layer);
        routeLocatorProcess_line();
    });
After the map loading is completed, we will perform the Route Locator Line operation. First, we need to get the route object according to the RouteID, and then proceed to subsequent operation.
                                function routeLocatorProcess_line() {
        //Establish route by SQL query and add it to the map
        var queryBySQLService = new ol.supermap.QueryService(baseUrl);
        var queryBySQLParams = new SuperMap.QueryBySQLParameters({
            queryParams: [
                new SuperMap.FilterParameter({
                    name: "RouteDT_road@Changchun",
                    attributeFilter: "RouteID=1690"
                })
            ]
        });
        queryBySQLService.queryBySQL(queryBySQLParams, function (SQLQueryServiceResult) {
            var queryBySQLResult = SQLQueryServiceResult.result.recordsets[0].features;
            var pathSource = new ol.source.Vector({
                features: (new ol.format.GeoJSON()).readFeatures(queryBySQLResult)
            });
            var pathLayer = new ol.layer.Vector({
                source: pathSource,
                style: new ol.style.Style({
                    stroke: new ol.style.Stroke({
                        color: 'rgba(100, 100, 225, 10)',
                        width: 3
                    })
                })
            });
            map.addLayer(pathLayer);

            //Extract the points that form the route to construct polyline of sourceRoute
            var pointsList = [];
            var routeObj = queryBySQLResult.features[0].geometry.coordinates[0];
            for (var i = 0; i < routeObj.length; i++) {
                pointsList.push([routeObj[i][0], routeObj[i][1], routeObj[i][2]])
            }
            var routeLine = new ol.geom.LineString([pointsList]);

            //routeLocatorService
            var routeLocatorService = new ol.supermap.SpatialAnalystService(serviceUrl);
            var routeLocatorParameters_line = new SuperMap.RouteLocatorParameters({
                "sourceRoute": routeLine,
                "type": "LINE",
                "startMeasure": 200,
                "endMeasure": 1000,
                "isIgnoreGap": true
            });
            routeLocatorService.routeLocate(routeLocatorParameters_line, function (routeLocateServiceResult) {
                var vectorSource = new ol.source.Vector({
                    features: [(new ol.format.GeoJSON()).readFeature(routeLocateServiceResult.result.resultGeometry)],
                    wrapX: false
                });
                resultLayer = new ol.layer.Vector({
                    source: vectorSource,
                    style: new ol.style.Style({
                        stroke: new ol.style.Stroke({
                            color: 'red',
                            width: 3
                        }),
                        fill: new ol.style.Fill({
                            color: 'rgba(0, 0, 255, 0.1)'
                        })
                    })
                });
                map.addLayer(resultLayer);
            });
        });
    }
Run effects
Using Traffic Network Analysis服务
Traffic network analysis functions supported by SuperMap iClient for OpenLayers include:
- Optimal Path Analysis
- Service Area Analysis
- Travelling Salesman Analysis
- Closest Facility Analysis
- Location Allocation Analysis
- Multiple Travelling Salesmen Analysis
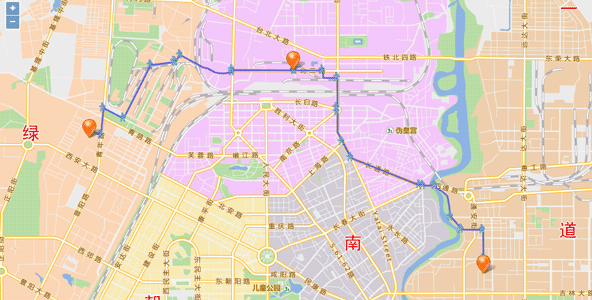
Sample: Optimal Path Analysis
The optimal path analysis is to find the route with the minimum impedance between two points in the network. It is necessary to access nodes in the network according to the selection order of nodes. Minimum Impedance can be the shortest time, the lowest cost, the best scenery, the best road conditions, the least bridges, the minimum toll stations, most villages passed and so on.
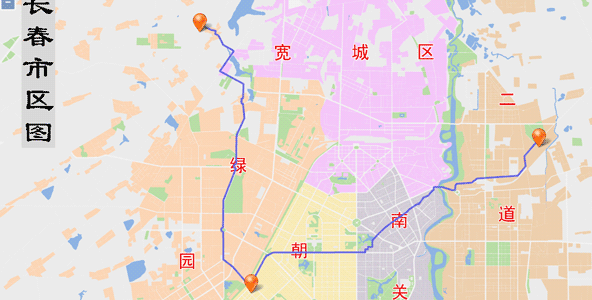
Here we introduce how to get the optimal path between two specified points on the map.
Set findPathParams, including common parameters for traffic network analysis, stops passed, etc.
                                    //Create optimal path analysis parameter instance
        var resultSetting = new SuperMap.TransportationAnalystResultSetting({
            returnEdgeFeatures: true,
            returnEdgeGeometry: true,
            returnEdgeIDs: true,
            returnNodeFeatures: true,
            returnNodeGeometry: true,
            returnNodeIDs: true,
            returnPathGuides: true,
            returnRoutes: true
        });
        var analystParameter = new SuperMap.TransportationAnalystParameter({
            resultSetting: resultSetting,
            weightFieldName: "length"
        });
        var findPathParameter = new SuperMap.FindPathParameters({
            isAnalyzeById: false,
            nodes: [new ol.geom.Point([4000, -3000]), new ol.geom.Point([5500, -2500]), new ol.geom.Point([6900, -4000])],
            hasLeastEdgeCount: false,
            parameter: analystParameter
        });
Send the request for optimal path analysis to the server and parse the serviceResult returned from the server if the analysis successful. Finally, display the route on the map and provide the path guides.
                                    //Search
        new ol.supermap.NetworkAnalystService(serviceUrl).findPath(findPathParameter, function (serviceResult) {
            var guideLayerStyle = new ol.style.Style({
                image: new ol.style.Icon(({
                    src: 'https://iserver.supermap.io/iserver/iClient/forJavaScript/examples/images/walk.png',
                    size: [20, 20]
                }))
            });
            var routeLayerStyle = new ol.style.Style({
                stroke: new ol.style.Stroke({
                    color: 'rgba(100, 100, 225, 10)',
                    width: 3
                }),
                fill: new ol.style.Fill({
                    color: 'rgba(0, 0, 255, 0.1)'
                })
            });
            serviceResult.result.pathList.map(function (result) {
                //Add paths analyzed
                var routeSource = new ol.source.Vector({
                    features: (new ol.format.GeoJSON()).readFeatures(result.route)
                });
                var pathLayer = new ol.layer.Vector({
                    source: routeSource,
                    style: routeLayerStyle
                });
                map.addLayer(pathLayer);
                //Add guide nodes analyzed
                var guideSource = new ol.source.Vector({
                    features: (new ol.format.GeoJSON()).readFeatures(result.pathGuideItems)
                });
                var guideLayer = new ol.layer.Vector({
                    source: guideSource,
                    style: guideLayerStyle
                });
                map.addLayer(guideLayer);
            });
        });
Run effects
Sample: Service Area Analysis
Service area analysis finds the serving area of a supply center in the network. For example, we can calculate the serving area within 30 minutes for a point in the network. Time cost for all points to the specified point within the result area will be less than 30 minutes.
Here we will do buffer analysis for center points selected. We choose the incrementing value 400, 500, 600... as service radius for the center points according to the selection order.
The usage of interfaces for service area analysis:
Set findServiceAreasParams, including traffic network analysis common parameters, passed stops, etc.
                            var resultSetting = new SuperMap.TransportationAnalystResultSetting({
            returnEdgeFeatures: true,
            returnEdgeGeometry: true,
            returnEdgeIDs: true,
            returnNodeFeatures: true,
            returnNodeGeometry: true,
            returnNodeIDs: true,
            returnPathGuides: true,
            returnRoutes: true
        });
        var analystParameter = new SuperMap.TransportationAnalystParameter({
            resultSetting: resultSetting,
            weightFieldName: "length"
        });
        var parameter = new SuperMap.FindServiceAreasParameters({
            centers: [point],
            isAnalyzeById: false,
            parameter: analystParameter
        });
        parameter.weights = [400 + Math.random() * 100];
Define the service area analysis service object to pass the parameters specified by the client to the server and receive the result data. If the client has sent the request and the server has returned the results successfully, the user can receive the analysis results and handle the results.
                            new ol.supermap.NetworkAnalystService(serviceUrl).findServiceAreas(parameter, function (serviceResult) {
            var vectorSource = new ol.source.Vector({
                features: (new ol.format.GeoJSON()).readFeatures(serviceResult.result.serviceAreaList[0].edgeFeatures)
            });
            var resultLayer = new ol.layer.Vector({
                source: vectorSource
            });
            map.addLayer(resultLayer);
        });
Run effects
Sample: Travelling Salesman Analysis
The travelling salesman analysis is to find the path that passes through a specified set of points. It is unordered path analysis. The traveler can decide the order to pass the nodes to achieve minimum (or closest to minimum) impedance.
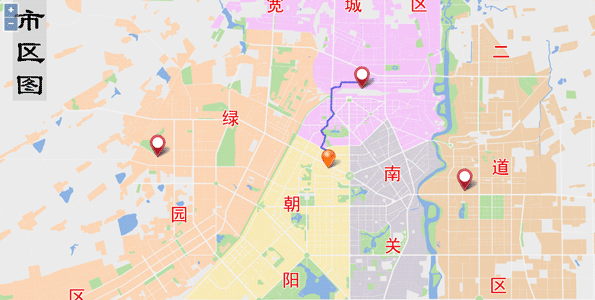
For travelling salesman analysis, if a termination point is specified, the traveler must access termination point last, and the order of other points can be determined by the traveler itself. Here we will introduce how to perform travelling salesman analysis. The sample data used is Changchun data.
Set findTSPPathsParams, including traffic network analysis common parameters, passed stops, etc.
                            //Traffic network analysis result parameters
        var resultSetting = new SuperMap.TransportationAnalystResultSetting({
            returnEdgeFeatures: true,
            returnEdgeGeometry: true,
            returnEdgeIDs: true,
            returnNodeFeatures: true,
            returnNodeGeometry: true,
            returnNodeIDs: true,
            returnPathGuides: true,
            returnRoutes: true
        });
        var analystParameter = new SuperMap.TransportationAnalystParameter({
            resultSetting: resultSetting,
            weightFieldName: "length"
        });
        var findTSPPathsParameter = new SuperMap.FindTSPPathsParameters({
            //Whether to specify termination point
            endNodeAssigned: false,
            isAnalyzeById: false,
            //The array of passed nodes for travelling salesman analysis. Required
            nodes: [new ol.geom.Point([3000, -1000]), new ol.geom.Point([3760, -4850]), new ol.geom.Point([8000, -2700])],
            parameter: analystParameter
        });
Define the travelling salesman analysis service object to pass the parameters specified by the client to the server and receive the result data. If the client has sent the request and the server has returned the results successfully, the user can receive the analysis results and handle the results.
                                    //Search
        new ol.supermap.NetworkAnalystService(serviceUrl).findTSPPaths(findTSPPathsParameter, function (serviceResult) {
            serviceResult.result.tspPathList.map(function (result) {
                var vectorSource = new ol.source.Vector({
                    features: (new ol.format.GeoJSON()).readFeatures(result.route)
                });
                var resultLayer = new ol.layer.Vector({
                    source: vectorSource,
                    style: new ol.style.Style({
                        stroke: new ol.style.Stroke({
                            color: 'rgba(100, 100, 225, 10)',
                            width: 3
                        }),
                        fill: new ol.style.Fill({
                            color: 'rgba(0, 0, 255, 0.1)'
                        })
                    })
                });
                map.addLayer(resultLayer);
            });
        });
Run effects
Sample:Closest Facility Analysis
Closest facility analysis finds the one or more facility points from the event point with the least cost in the network after giving one event point and a set of facility points. The results contain the optimal path, cost, and direction of travel from the event point to the facility point (or from the facility point to the event point). For example, the incident point is a traffic accident, and facility points are hospitals around. The closest facility analysis is to find the nearest hospitals which can be arrived in 10 minutes. In this case, the position where the accident happens is an event point, and the surrounding hospitals are facility points. Closest facility analysis is actually a path analysis, therefore, you can set barrier edges and nodes in the network to indicates that these edges or nodes can not be crossed.
Here we will introduce how to find the closest hospital for an accident marked on the map. The sample data used here is Changchun data.
Set closest facility analysis parameters, including traffic network analysis common parameters, event points, facility points, searching radius, etc.
                                    //Add facility points
        var facilityPoint1 = new ol.geom.Point([2500, -3500]);
        var facilityPoint2 = new ol.geom.Point([5500, -2500]);
        var facilityPoint3 = new ol.geom.Point([7000, -4000]);
        var facilityFeature1 = new ol.Feature(facilityPoint1);
        var facilityFeature2 = new ol.Feature(facilityPoint2);
        var facilityFeature3 = new ol.Feature(facilityPoint3);
        var iconStyle_facility = new ol.style.Style({
            image: new ol.style.Icon(({
                src: 'https://iserver.supermap.io/iserver/iClient/forJavaScript/theme/images/marker-gold.png'
            }))
        });
        facilityFeature1.setStyle(iconStyle_facility);
        facilityFeature2.setStyle(iconStyle_facility);
        facilityFeature3.setStyle(iconStyle_facility);
        var facilitySource = new ol.source.Vector({
            features: [facilityFeature1, facilityFeature2, facilityFeature3]
        });
        var facilityLayer = new ol.layer.Vector({
            source: facilitySource
        });
        //Add event pionts
        var eventPoint = new ol.geom.Point([5000, -3700]);
        var eventFeature = new ol.Feature(eventPoint);
        var iconStyle_event = new ol.style.Style({
            image: new ol.style.Icon(({
                src: 'https://iserver.supermap.io/iserver/iClient/forJavaScript/theme/images/marker.png'
            }))
        });
        eventFeature.setStyle(iconStyle_event);
        var eventSource = new ol.source.Vector({
            features: [eventFeature]
        });
        var eventLayer = new ol.layer.Vector({
            source: eventSource
        });
        //Create closest facility analysis parameter instance
        var resultSetting = new SuperMap.TransportationAnalystResultSetting({
            returnEdgeFeatures: true,
            returnEdgeGeometry: true,
            returnEdgeIDs: true,
            returnNodeFeatures: true,
            returnNodeGeometry: true,
            returnNodeIDs: true,
            returnPathGuides: true,
            returnRoutes: true
        });
        var analystParameter = new SuperMap.TransportationAnalystParameter({
            resultSetting: resultSetting,
            turnWeightField: "TurnCost",
            weightFieldName: "length"  //length,time
        });
        var findClosetFacilitiesParameter = new SuperMap.FindClosestFacilitiesParameters({
            //Event point, required
            event: new ol.geom.Point([5000, -3700]),
            //The number of facility number to be queried. Default is 1.
            expectFacilityCount: 1,
            //Facility point collection, required
            facilities: [new ol.geom.Point([2500, -3500]), new ol.geom.Point([5500, -2500]), new ol.geom.Point([7000, -4000])],
            isAnalyzeById: false,
            parameter: analystParameter
        });
Define the closest facility analysis service object to pass the parameters specified by the client to the server and receive the result data. If the client has sent the request and the server has returned the results successfully, the user can receive the analysis results and handle the results.
                                    //Search
        new ol.supermap.NetworkAnalystService(serviceUrl).findClosestFacilities(findClosetFacilitiesParameter, function (serviceResult) {
            serviceResult.result.facilityPathList.map(function (result) {
                var vectorSource = new ol.source.Vector({
                    features: (new ol.format.GeoJSON()).readFeatures(result.route)
                });
                var pathLayer = new ol.layer.Vector({
                    source: vectorSource,
                    style: new ol.style.Style({
                        stroke: new ol.style.Stroke({
                            color: 'rgba(100, 100, 225, 10)',
                            width: 3
                        }),
                        fill: new ol.style.Fill({
                            color: 'rgba(0, 0, 255, 0.1)'
                        })
                    })
                });
                map.addLayer(pathLayer);
            });
            map.addLayer(facilityLayer);
            map.addLayer(eventLayer);
        });
Run effects
Sample: Location Allocation Analysis
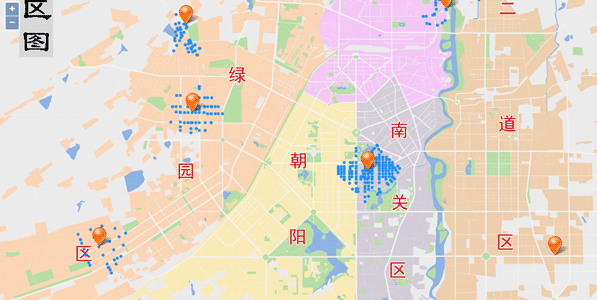
Allocation and Location is to find the optimal location from multiple candidate locations for a facility, by matching the supply and demand based on the objectives and constraints. The Allocation and Location analysis can be applied to the applications such as locating a restaurant, a school, an airport, etc.
Set location-allocation analysis parameters, including traffic network analysis common parameters, passed stops, etc.
                                    //Add facility points
        var facilityPoint1 = new ol.geom.Point([1675.9256791377206, -593.56822512495194]);
        var facilityPoint2 = new ol.geom.Point([2820.35101097629, -2358.0414663985171]);
        var facilityPoint3 = new ol.geom.Point([2909.4396668115278, -3647.0074300836109]);
        var facilityPoint4 = new ol.geom.Point([1544.5037476378677, -5616.5950974905827]);
        var facilityPoint5 = new ol.geom.Point([6623.5972101719526, -2130.4887600981415]);
        var facilityPoint6 = new ol.geom.Point([5482.4979617984973, -4504.2328567816048]);
        var facilityPoint7 = new ol.geom.Point([6940.6579024271468, -1627.6012900626256]);
        var facilityPoint8 = new ol.geom.Point([8215.9188781715948, -5747.5063918659716]);
        var facilityFeature1 = new ol.Feature(facilityPoint1);
        var facilityFeature2 = new ol.Feature(facilityPoint2);
        var facilityFeature3 = new ol.Feature(facilityPoint3);
        var facilityFeature4 = new ol.Feature(facilityPoint4);
        var facilityFeature5 = new ol.Feature(facilityPoint5);
        var facilityFeature6 = new ol.Feature(facilityPoint6);
        var facilityFeature7 = new ol.Feature(facilityPoint7);
        var facilityFeature8 = new ol.Feature(facilityPoint8);
        var iconStyle_facility = new ol.style.Style({
            image: new ol.style.Icon(({
                src: 'https://iserver.supermap.io/iserver/iClient/forJavaScript/theme/images/marker.png',
                anchor: [0.5, 1]
            }))
        });
        facilityFeature1.setStyle(iconStyle_facility);
        facilityFeature2.setStyle(iconStyle_facility);
        facilityFeature3.setStyle(iconStyle_facility);
        facilityFeature4.setStyle(iconStyle_facility);
        facilityFeature5.setStyle(iconStyle_facility);
        facilityFeature6.setStyle(iconStyle_facility);
        facilityFeature7.setStyle(iconStyle_facility);
        facilityFeature8.setStyle(iconStyle_facility);
        var facilitySource = new ol.source.Vector({
            features: [
                facilityFeature1, facilityFeature2,
                facilityFeature3, facilityFeature4,
                facilityFeature5, facilityFeature6,
                facilityFeature7, facilityFeature8
            ]
        });
        var facilityLayer = new ol.layer.Vector({
            source: facilitySource
        });

        // Set resource supply centers for facility points
        var supplyCenterType_FIXEDCENTER = SuperMap.SupplyCenterType.FIXEDCENTER,
            supplyCenterType_NULL = SuperMap.SupplyCenterType.NULL;
        var supplyCenterType_OPTIONALCENTER = SuperMap.SupplyCenterType.OPTIONALCENTER,
            supplyCenters = [new SuperMap.SupplyCenter({
maxWeight: 500,//The max cost of resource supply center
    nodeID: 139,//The node ID of resource supply center
    resourceValue: 100,//The maximum amount of service or quantity of goods a resource supply center can provide
    type: supplyCenterType_OPTIONALCENTER//Type of resource center
            }),
                new SuperMap.SupplyCenter({
                    maxWeight: 500,
                    nodeID: 1358,
                    resourceValue: 100,
                    type: supplyCenterType_OPTIONALCENTER
                }),
                new SuperMap.SupplyCenter({
                    maxWeight: 500,
                    nodeID: 2972,
                    resourceValue: 100,
                    type: supplyCenterType_OPTIONALCENTER
                }),
                new SuperMap.SupplyCenter({
                    maxWeight: 500,
                    nodeID: 5523,
                    resourceValue: 100,
                    type: supplyCenterType_OPTIONALCENTER
                }),
                new SuperMap.SupplyCenter({
                    maxWeight: 500,
                    nodeID: 1161,
                    resourceValue: 100,
                    type: supplyCenterType_OPTIONALCENTER
                }),
                new SuperMap.SupplyCenter({
                    maxWeight: 500,
                    nodeID: 4337,
                    resourceValue: 100,
                    type: supplyCenterType_OPTIONALCENTER
                }),
                new SuperMap.SupplyCenter({
                    maxWeight: 500,
                    nodeID: 5732,
                    resourceValue: 100,
                    type: supplyCenterType_NULL
                }),
                new SuperMap.SupplyCenter({
                    maxWeight: 500,
                    nodeID: 663,
                    resourceValue: 100,
                    type: supplyCenterType_FIXEDCENTER
                })
            ];
//Create FindLocationParameters instance
        var findLocationParameter = new SuperMap.FindLocationParameters({
//Number of resource centres expected
            expectedSupplyCenterCount: 8,
//Whether to start allocating resources from supply center
            isFromCenter: false,
            nodeDemandField: "Demand",
//Node demand field
            turnWeightField: "TurnCost",
//Turn weight field
            weightName: "length",
//Name of the impedance field
            supplyCenters: supplyCenters
        });
Define the location-allocation analysis service object to pass the parameters specified by the client to the server and receive the result data. If the client has sent the request and the server has returned the results successfully, the user can receive the analysis results and handle the results.
                                    //Search
        new ol.supermap.NetworkAnalystService(serviceUrl).findLocation(findLocationParameter, function (serviceResult) {
            var vectorSource = new ol.source.Vector({
                features: (new ol.format.GeoJSON()).readFeatures(serviceResult.result.demandResults)
            });
            var polygonLayer = new ol.layer.Vector({
                source: vectorSource,
                style: new ol.style.Style({
                    image: new ol.style.Circle({
                        radius: 2.5,
                        fill: new ol.style.Fill({
                            color: 'dodgerblue'
                        })
                    })
                })
            });
            map.addLayer(polygonLayer);
            map.addLayer(facilityLayer);
        });
Run effects
Sample: Multiple Travelling Salesmen Analysis
Multipel travelling salemen analysis is to find the most effective and economic path for the logistics centers to deliver goods to the destinations through a network. Unlike the Path Finding analysis, the Logistics Vehicle Routing Analysis often has more than one start point, that is the logistics centers, and more than one predefined destinations. The purpose of the analysis is to find the paths from the logistics centers to the destinations with the minimum cost in total, or find the path for each logistics center with the minimum cost.
The results of the multipel travelling salemen analysis will contain the destination responsible by each distribution center, the order of distribution of goods to all destinations, and the corresponding route, which can ensure the minimum cost for each distribution center, or the minimum total cost of all distribution centers.
Here we analyze the distribution routes of each warehouse distribution center to the user-designated retail stations using the multiple travelling salesmen analysis and travelling salesman analysis. The route with minimum cost for the quality inspector to check the goods regularly at each retail station will be given. The sample data used here is Changchun data.
Set findMTSPPathsParams, including traffic network analysis common parameters, supply center collection, supply destination collection, distribution mode, etc.
                                    //Add distribution points
        var facilityPoint1 = new ol.geom.Point([6000, -5500]);
        var facilityPoint2 = new ol.geom.Point([5500, -2500]);
        var facilityPoint3 = new ol.geom.Point([2500, -3500]);
        var facilityFeature1 = new ol.Feature(facilityPoint1);
        var facilityFeature2 = new ol.Feature(facilityPoint2);
        var facilityFeature3 = new ol.Feature(facilityPoint3);
        var iconStyle_facility = new ol.style.Style({
            image: new ol.style.Icon(({
                src: 'https://iserver.supermap.io/iserver/iClient/forJavaScript/theme/images/marker-gold.png'
            }))
        });
        facilityFeature1.setStyle(iconStyle_facility);
        facilityFeature2.setStyle(iconStyle_facility);
        facilityFeature3.setStyle(iconStyle_facility);
        var facilitySource = new ol.source.Vector({
            features: [facilityFeature1, facilityFeature2, facilityFeature3]
        });
        var facilityLayer = new ol.layer.Vector({
            source: facilitySource
        });

        //Add destination points
        var destPoint1 = new ol.geom.Point([5000, -5000]);
        var destPoint2 = new ol.geom.Point([6500, -3200]);
        var destFeature1 = new ol.Feature(destPoint1);
        var destFeature2 = new ol.Feature(destPoint2);
        var iconStyle_dest = new ol.style.Style({
            image: new ol.style.Icon(({
                src: 'https://iserver.supermap.io/iserver/iClient/forJavaScript/theme/images/marker.png'
            }))
        });
        destFeature1.setStyle(iconStyle_dest);
        destFeature2.setStyle(iconStyle_dest);
        var destSource = new ol.source.Vector({
            features: [destFeature1, destFeature2]
        });
        var destLayer = new ol.layer.Vector({
            source: destSource
        });

        //Create multiple travelling salesmen analysis parameter instance
        var resultSetting = new SuperMap.TransportationAnalystResultSetting({
            returnEdgeFeatures: true,
            returnEdgeGeometry: true,
            returnEdgeIDs: true,
            returnNodeFeatures: true,
            returnNodeGeometry: true,
            returnNodeIDs: true,
            returnPathGuides: true,
            returnRoutes: true
        });
        var analystParameter = new SuperMap.TransportationAnalystParameter({
            resultSetting: resultSetting,
            weightFieldName: "length"  //"length" or "time"
        });
        var findMTSPPathsParameter = new SuperMap.FindMTSPPathsParameters({
            centers: [new ol.geom.Point([6000, -5500]), new ol.geom.Point([5500, -2500]), new ol.geom.Point([2500, -3500])],
            isAnalyzeById: false,
            nodes: [new ol.geom.Point([5000, -5000]), new ol.geom.Point([6500, -3200])],
            hasLeastTotalCost: true,
            parameter: analystParameter
        });
Obtain the optimal routes from the distribution centers to distribution destinations by submitting the request parameters of logistic distribution analysis to the server, and parse the returned results from the server.
                                    //Search
        new ol.supermap.NetworkAnalystService(serviceUrl).findMTSPPaths(findMTSPPathsParameter, function (serviceResult) {
            serviceResult.result.pathList.map(function (result) {
                var vectorSource = new ol.source.Vector({
                    features: (new ol.format.GeoJSON()).readFeatures(result.route)
                });
                var pathLayer = new ol.layer.Vector({
                    source: vectorSource,
                    style: new ol.style.Style({
                        stroke: new ol.style.Stroke({
                            color: 'rgba(100, 100, 225, 10)',
                            width: 3
                        }),
                        fill: new ol.style.Fill({
                            color: 'rgba(0, 0, 255, 0.1)'
                        })
                    })
                });
                map.addLayer(pathLayer);
            });
            map.addLayer(facilityLayer);
            map.addLayer(destLayer);
        });
Run effects
Using Traffic Transfer Analysis Service
Traffic Transfer Analysis is introduced below:
- Define start stop and end stop query function.
- Perform the traffic transfer query. First of all, we must set the traffic transfer parameters on the client side, define the traffic transfer service, and then send the request to the server. When the results are returned to the cient from the server, the client needs to parse the results and display the results.
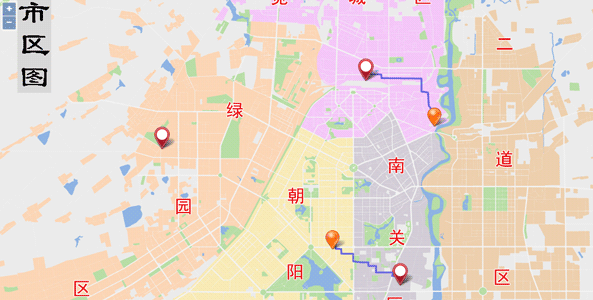
Here we introduce how to perform traffic transfer analysis using the bus line data monitored using the Changchun road data.
1. Query traffic transfer solutions
Traffic solution query: This method returns all bus solutions, and the specific route information can be acquired depending on the information presented in the solution. First, you need to set the traffic transfer parameters, including solutionCount, transferTactic, transferPreference, walkingRatio, points, define the traffic transfer service function, Send a request to the server, and parse the traffic transfer result data returned from the server.
                            var map, startMarker, endMarker, container, content, tempMarker, solution, line,
        stopSourceLayer, roadSourceLayer, tempMarkerSourceLayer, tempRedSourceLayer,
        info, paths = {transSolutions: null, solutions: null},
        baseUrl = "https://iserver.supermap.io/iserver/services/map-changchun/rest/maps/ChangchunCityMap",
        serviceUrl = "https://iserver.supermap.io/iserver/services/traffictransferanalyst-sample/restjsr/traffictransferanalyst/Traffic-Changchun";
    var extent = [48.4, -7668.25, 8958.85, -55.58];
    var projection = new ol.proj.Projection({
        extent: extent,
        units: 'm'
    });
    new ol.supermap.MapService(baseUrl).getMapInfo(function (serviceResult) {
        var mapJSONObj = serviceResult.result;
        map = new ol.Map({
            target: 'map',
            controls: ol.control.defaults({attributionOptions: {collapsed: false}})
                .extend([new ol.supermap.control.Logo()]),
            view: new ol.View({
                center: [4700, -3600],
                zoom: 2,
                projection: projection
            })
        });
        var options = ol.source.TileSuperMapRest.optionsFromMapJSON(baseUrl, mapJSONObj);
        var layer = new ol.layer.Tile({
            source: new ol.source.TileSuperMapRest(options)
        });
        stopSourceLayer = new ol.source.Vector();
        roadSourceLayer = new ol.source.Vector();
        tempRedSourceLayer = new ol.source.Vector();
        tempMarkerSourceLayer = new ol.source.Vector();
        map.addLayer(layer);

        //Set start, end points and add them to the map
        startMarker = new ol.Overlay({
            element: document.getElementById('startMarker'),
            positioning: 'center-center',
            position: [3111.42533851, -5527.73795456]
        });
        endMarker = new ol.Overlay({
            element: document.getElementById('endMarker'),
            positioning: 'center-center',
            position: [6055.3431955, -4270.0725196]
        });
        map.addOverlay(startMarker);
        map.addOverlay(endMarker);
        initResultInfoWin();
        execTransSolutionsQuery('LESS_TIME');  //4 methods are provided: 'LESS_TIME', 'MIN_DISTANCE', 'LESS_WALK', 'LESS_TRANSFER'
    });

    function initResultInfoWin() {
        container = document.getElementById('popup');
        content = document.getElementById('popup-content');
        info = new ol.control.Control({element: container});
        info.setMap(map);
        info.update = function (transSolutions, transGuide) {
            if (!transSolutions) {
                return;
            }
            var solution, lines, line, dispStatus = "block";
            $("<div class='panel-heading' style='background:steelblue;color: honeydew'>Start point: Auto Repair Shop      End point: Zhongan Mansion<br/>Transfer Solution (Least Time)</div>").appendTo(content);
            for (var i = 0, iLen = transSolutions.length; i < iLen; i++) {
                solution = transSolutions[i];
                //Display solution
                var title = "";
                for (var ii = 0, iiLen = solution.linesItems.length; ii < iiLen; ii++) {
                    lines = solution.linesItems[ii];
                    for (var iii = 0, iiiLen = lines.lineItems.length; iii < iiiLen; iii++) {
                        line = lines.lineItems[iii];
                        if (iii !== iiiLen - 1) {
                            title += line.lineName + "/";
                        } else {
                            title += line.lineName;
                        }
                    }
                    if (ii !== iiLen - 1) {
                        title += " → ";
                    }
                }
                $("<div class='transferSolution' id='transferSolution-" + i + "'><span class='transferIndex'>Solution " + (i + 1) + ":</span>" + title + "</div>").appendTo(content);
                if (i !== 0) {
                    dispStatus = "none";
                }
                var list = $("<div class='transferInfo' id='transferInfo-" + i + "' style='display:" + dispStatus + "'></div>");
                list.appendTo(content);
                //Display table of solution 1 by default
                if (i === 0) {
                    fillTransferInfo(transGuide, transSolutions, 0).appendTo(list);
                    setPopup();
                }
            }
            //Display the corresponding table while clicking a solution
            bindSolutionsClickEvent();
        };
        map.addControl(info);
    }

    function execTransSolutionsQuery(tactic) {
        paths.points = [26, 180];
        var params = new SuperMap.TransferSolutionParameters({
            solutionCount: 6,        //Max transfer guide number
            transferTactic: tactic,  //Bus transfer scheme type
            walkingRatio: 10,        //Weight ratio between walking and bus
            points: paths.points     //Start and end point coordinates
        });
        new ol.supermap.TrafficTransferAnalystService(serviceUrl)
            .analysisTransferSolution(params, function (serviceResult) {
                transferSolutionsSucceed(serviceResult.result);
            });
    }

    function transferSolutionsSucceed(result) {
        clearLayer();
        //Overlay symbol information on the map
        var transGuide = result.defaultGuide,
            transSolutions = result.solutionItems,
            solutions = [];
        for (var j = 0; j < transSolutions.length; j++) {
            var linesItems = transSolutions[j].linesItems, transSolution = [];
            for (var jj = 0; jj < linesItems.length; jj++) {
                var lineItems = linesItems[jj].lineItems, items = [];
                for (var jjj = 0; jjj < lineItems.length; jjj++) {
                    var lineItem = lineItems[jjj];
                    items.push(lineItem
                    );
                }
                transSolution.push(items);
            }
            solutions.push(transSolution);
        }
        paths["transSolutions"] = transSolutions;
        paths["solutions"] = solutions;
        if (!transGuide || !transSolutions) return;
        info.update(transSolutions, transGuide);
    }

    function fillTransferInfo(transGuide, transSolutions, indexX) {
        clearLayer();
        //Display route on the map
        if (transGuide && transGuide.items.length) {
            var items = transGuide.items;
            for (var itemIndex = 0, itemLen = items.length; itemIndex < itemLen; itemIndex++) {
                var geometry = items[itemIndex].route;
                var pointsList = [];
                for (var k = 0; k < geometry.points.length; k++) {
                    pointsList.push([geometry.points[k].x, geometry.points[k].y]);
                }
                var roadLine = new ol.geom.LineString(pointsList);
                roadSourceLayer.addFeatures([new ol.Feature(roadLine)]);
                var roadResultLayer = new ol.layer.Vector({
                    source: roadSourceLayer,
                    style: new ol.style.Style({
                        stroke: new ol.style.Stroke({
                            color: 'dodgerblue',
                            width: 3
                        })
                    })
                });
                map.addLayer(roadResultLayer);
            }
        }
        var table = $("<table id='trafficRes' border='1'></table>");
        var startStop = $("<tr></tr>");
        $("<td class='start_transfer' width='10px'></td>").appendTo(startStop);
        $("<td colspan='2'><span class='busLink bgSpan'><span style='display:none'>" + transGuide.items[0].startPosition.x + "," + transGuide.items[0].startPosition.y + "</span>" + transGuide.items[0].startStopName + "</span></td>").appendTo(startStop);
        startStop.appendTo(table);
        var indexY = 0;
        for (var m = 0, mLen = transGuide.items.length; m < mLen; m++) {
            var item = transGuide.items[m];
            var tr2 = $("<tr></tr>");
            if (item.isWalking) {
                $("<td class='step_transfer' ></td>").appendTo(tr2);
                $("<td> Walk to: <a class='busLink'><span style='display:none'>" + item.endPosition.x + "," + item.endPosition.y + "</span>" + item.endStopName + "</a></td>").appendTo(tr2);
                $("<td>" + parseInt(item.distance) + " m </td>").appendTo(tr2);
            } else {
                var otherLines = transSolutions[indexX].linesItems[indexY],
                    links = "";
                if (otherLines && otherLines.lineItems.length > 1) {
                    links = "</br> or take: "
                    for (var oti = 0, otLen = otherLines.lineItems.length; oti < otLen; oti++) {
                        var line = otherLines.lineItems[oti];
                        if (item.lineName !== line.lineName) {
                            var other = indexX + "," + indexY + "," + oti + ",0";
                            links += "<a class='busLink'><span style='display:none'>" + other + "</span>" + line.lineName + "</a>";
                        }
                    }
                }
                $("<td class='bus_transfer'></td>").appendTo(tr2);
                var points = item.route.points, pointStr = "";
                for (var i = 0; i < points.length; i++) {
                    pointStr += points[i].x + " " + points[i].y;
                    if (i != points.length - 1) {
                        pointStr += ",";
                    }
                }
                $("<td> Take <a class='busLink'>" + item.lineName + "<span style='display:none'>" + pointStr + "</span></a>, at <a class='busLink'><span style='display:none'>" + item.endPosition.x + "," + item.endPosition.y + "</span>" + item.endStopName + "</a> Get off " + links + "</td>").appendTo(tr2);
                $("<td>" + item.passStopCount + " stop </td>").appendTo(tr2);
                indexY++;
            }
            tr2.appendTo(table);
        }
        var endStop = $("<tr></tr>");
        endStop.appendTo(table);
        $("<td class='end_transfer' width='10px'></td>").appendTo(endStop);
        $("<td colspan='2'><span class='busLink bgSpan'><span style='display:none'>" + transGuide.items[transGuide.items.length - 1].endPosition.x + "," + transGuide.items[transGuide.items.length - 1].endPosition.y + "</span>" + transGuide.items[transGuide.items.length - 1].endStopName + "</span></td>").appendTo(endStop);
        return table;
    }

    function clearLayer() {
        if (roadSourceLayer) {
            roadSourceLayer.clear();
        }
        if (tempMarkerSourceLayer) {
            tempMarkerSourceLayer.clear();
        }
        if (tempRedSourceLayer) {
            tempRedSourceLayer.clear();
        }
    }
2. Bus route query
Obtain the detailed information of a bus route according to the travel scheme obtained by transferSolutions.
                                function bindSolutionsClickEvent() {
        for (var i = 0; i < 6; i++) {
            $("#transferSolution-" + i).click(toggleGuideItems);
        }
        function toggleGuideItems(e) {
            for (var j = 0; j < 6; j++) {
                $("#transferInfo-" + j).hide(500);
            }
            var id = parseInt(e.currentTarget.id.split("-")[1]);
            $("#transferInfo-" + id).show(500);
            //Construct transferLines passed into iServer
            var transLines = [];
            for (var i = 0; i < paths.solutions[id].length; i++) {
                var trans = paths.solutions[id][i][0];
                transLines.push(trans);
            }
            execTransPathQuery(id, transLines);
        }
    }

    //In the popup dialog box, click on each site, traffic route, to display and highlight on the map
    function setPopup() {
        $(".busLink").click(function () {
            if (tempMarkerSourceLayer) {
                tempMarkerSourceLayer.clear();
            }
            if (tempRedSourceLayer) {
                tempRedSourceLayer.clear();
            }
            var points = this.children[0].innerText.split(",");
            //Add marker for transfer points
            if (points.length === 2) {
                tempMarker = new ol.geom.Point([points[0], points[1]]);
                var iconStyle_marker = new ol.style.Style({
                    image: new ol.style.Icon(({
                        src: 'https://iserver.supermap.io/iserver/iClient/forJavaScript/theme/images/marker.png',
                        anchor: [0.5, 1]
                    }))
                });
                var tempMarkerFeature = new ol.Feature(tempMarker);
                tempMarkerFeature.setStyle(iconStyle_marker);
                tempMarkerSourceLayer.addFeatures([tempMarkerFeature]);
                var markerLayer = new ol.layer.Vector({
                    source: tempMarkerSourceLayer
                });
                map.addLayer(markerLayer);
                var coords = tempMarker.getCoordinates();
                map.getView().setCenter([parseInt(coords[0]), parseInt(coords[1])]);
                map.getView().setZoom(3)
            } else if (points.length === 4 && points[3] === "0") {
                var linesItems = paths["solutions"][points[0]], lineStr = "[";
                for (var i = 0; i < linesItems.length; i++) {
                    var lineItem = linesItems[i][0], j = parseInt(points[1]);
                    if (i !== j) {
                        lineStr += lineItem;
                    } else if (i === j) {
                        lineItem = linesItems[points[1]][points[2]];
                        lineStr += lineItem;
                    }
                    if (i !== linesItems.length - 1) {
                        lineStr += ",";
                    }
                }
                lineStr += "]";
                $("#transferInfo-" + points[0]).hide(500);
                execTransPathQuery(points[0], lineStr);
                $("#transferInfo-" + points[0]).show(500);
            } else {
                var linePoints = [];
                for (var i = 0; i < points.length; i++) {
                    var arr = points[i].split(" ");
                    var point = [parseInt(arr[0]), parseInt(arr[1])];
                    linePoints.push(point);
                }
                var lineString = new ol.geom.LineString(linePoints);
                tempRedSourceLayer.addFeatures([new ol.Feature(lineString)]);
                var tempRedLayer = new ol.layer.Vector({
                    source: tempRedSourceLayer,
                    style: new ol.style.Style({
                        stroke: new ol.style.Stroke({
                            color: 'red',
                            width: 6
                        })
                    })
                });
                map.addLayer(tempRedLayer);
                //Set route center
                var lineCenter = [];
                if ((linePoints.length) % 2 == 0) {
                    lineCenter = [linePoints[linePoints.length / 2][0], linePoints[linePoints.length / 2][1]];
                    map.getView().setCenter([parseInt(lineCenter[0]), parseInt(lineCenter[1])]);
                } else {
                    lineCenter = [linePoints[(linePoints.length + 1) / 2][0], linePoints[(linePoints.length + 1) / 2][1]];
                    map.getView().setCenter([parseInt(lineCenter[0]), parseInt(lineCenter[1])]);
                }
                map.getView().setZoom(3);
            }
        });
    }

    function execTransPathQuery(id, transLines) {
        var params = new SuperMap.TransferPathParameters({
            points: paths["points"],
            transferLines: transLines
        });
        new ol.supermap.TrafficTransferAnalystService(serviceUrl)
            .analysisTransferPath(params, function (serviceResult) {
                $("#transferInfo-" + id).empty();
                var transGuide = serviceResult.result;
                transSolutions = paths["transSolutions"];
                map.getView().setCenter([4700, -3600]);
                map.getView().setZoom(2);
                fillTransferInfo(transGuide, transSolutions, id).appendTo($("#transferInfo-" + id));
                setPopup();
            });
    }
Run effects
Here only the route with least time cost will display. The query effect is as shown below:
Using Distributed Analysis Services
Distributed analysis services supported by SuperMap iClient for OpenLayers include:
- Density Analysis
- Point Aggregation Analysis
- Single Object Query Analysis
- Region Summary Analysis
- Vector Clip Analysis
Sample: Density Analysis
Density analysis in distributed analysis services includes simple point density analysis and kernel density analysis.
- Simple point density analysis: Calculates the measure value per unit of the specified neighborhood area of a point. The value is calculated by dividing the sum of the measured values by the area of the specified neighborhood, and the density values will be added at the neighborhood superposition of the points. The density value of each output grid cell is the sum of density values of all the adjacent density values superimposed on the grid. The unit of the result grid is the reciprocal of the square of the original dataset unit. For example, if the original dataset unit is meter, then the result grid value unit is per square meter.
- Kernel density analysis: Calculates the point and line element measurement values within the specified neighborhood range. In a nutshell, it can directly reflect the distribution of discrete measurement values in the continuous region. The result is a smooth surface with small peripheral value and the grid value is the unit density, which is reduced to 0 at the neighborhood boundary. Kernel density analysis can be used to calculate population density, building density, crime report access, tourism area density monitoring, chain store operation analysis and so on.
Here we perform a simple point density analysis on registered big data, and the grid surface type is quadrilateral grid.
Set kernelDensityJobParams, including dataset, analysis method, analysis type, grid size, etc.
                            //Density analysis parameters
var kernelDensityJobParams = new SuperMap.KernelDensityJobParameter({
//Name of the registered dataset
datasetName: "newyork_taxi_2013_01_14k_csv_newyork_taxi_2013-01_14k",
//Grid size. For the quadrilateral, it is the grid length. For hexagonal meshes, it is the distance from the hexagonal vertex to the center point
    resolution: 80,
//Analysis method, specify whether the analysis method is simple point density analysis, or kernel density analysis. 0 represents the former, and 1 represents the latter
    method:0,
//Grid surface type, specify whether the grid unit is a quadrilateral grid or a hexagonal grid. 0 represents the former, and 1 represents the latter
    meshType:0,
//Specifies the field index column number collection of the weight value of the points to be analyzed, and the field index starts at 0. The format is as follows: col7, col8
    fields: col7,col8,
    query: Bounds, //Analysis bounds
    radius: 300, //The impact radius of the analysis
    meshSizeUnit: Meter, //Grid size unit
radiusUnit: Meter, //Search radius unit
    areaUnit: SquareMile, //Area unit
});
Submit the request for kernel analysis to the server, parse the results returned from the server, and display the results on the map.
                                    var processingService = new ol.supermap.ProcessingService(processingsUrl);
        processingService.addKernelDensityJob(kernelDensityJobParameter, function (serviceResult) {
            serviceResult.result.setting.serviceInfo.targetServiceInfos.map(function (info) {
                if (info.serviceType === 'RESTMAP') {
                    SuperMap.FetchRequest.get(info.serviceAddress + '/maps').then(function (response) {
                        return response.json();
                    }).then(function (result) {
                        var mapUrl = result[0].path;
                        new ol.supermap.MapService(mapUrl).getMapInfo(function (mapInfo) {
                            layer = new ol.layer.Tile({
                                source: new ol.source.ImageSuperMapRest(ol.source.ImageSuperMapRest.optionsFromMapJSON(mapUrl, mapInfo.result))
                            });
                            map.addLayer(layer);
                        });
                    });
                }
            });
        });
Run effects
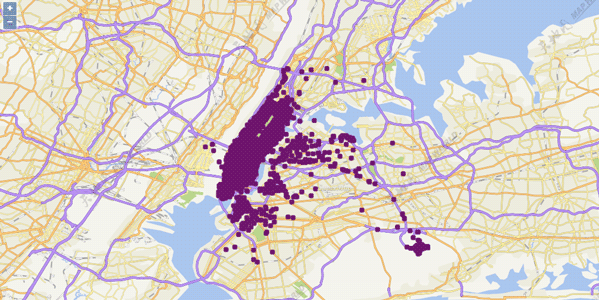
Sample: Point Aggregation Analysis
Point aggregation analysis refers to a spatial analysis operation for making aggregation maps for point datasets. divide the point elements of a map according to surface or polygons, and then calculate the number of points in each surface object, which will be regarded as the statistic value of the surface object. The weights of the points can also be introduced, and the weighted values of the interior points of the surface objects are considered as the statistic values of the surface objects. Based on the statistical values of the surface objects, the values will be sorted and the surface objects will be filled with color ramp.
Currently supported point aggregation analysis types include: grid surface aggregation and polygon aggregation, in which grid surface aggregation can be divided into quadrilateral grids and hexagonal grids.
Here we will implement a point aggregation analysis on the registered big data. The aggregation type is a grid surface aggregation, and the grid surface type is quadrilateral.
Set summaryMeshJobParam, including dataset, aggregation type, statistical mode, grid size, etc.
                            //Point aggregation analysis parameters
var summaryMeshJobParam = new SuperMap.SummaryMeshJobParameter({
//Name of the registered dataset
datasetName: "newyork_taxi_2013_01_14k_csv_newyork_taxi_2013-01_14k",
//Grid size. For the quadrilateral, it is the grid length. For hexagonal meshes, it is the distance from the hexagonal vertex to the center point
    resolution: 80,
//Grid surface type, specify whether the grid unit is a quadrilateral grid or a hexagonal grid. 0 represents the former, and 1 represents the latter
    meshType:0,
//Specifies the field index column number collection of the weight value of the points to be analyzed, and the field index starts at 0. The format is as follows: col7, col8
    fields: col7,
    query: Bounds, //Analysis bounds
    statisticModes:,//Statistics mode, which needs to be consistent with the number of weight value fields
    type:, SummaryType//Aggregation type, specifies whether the aggregation type is a grid surface aggregation or polygon aggregation.
    //regionDataset: 'regionDataset', Aggregation surface dataset, used during polygon aggregation
});
Submit the request for point aggregation analysis to the server, parse the results returned from the server, and display the results on the map.
                                    var processingService = new ol.supermap.ProcessingService(processingsUrl);
        processingService.addSummaryMeshJob(summaryMeshJobParameter, function (serviceResult) {
            serviceResult.result.setting.serviceInfo.targetServiceInfos.map(function (info) {
                if (info.serviceType === 'RESTMAP') {
                    SuperMap.FetchRequest.get(info.serviceAddress + '/maps').then(function (response) {
                        return response.json();
                    }).then(function (result) {
                        var mapUrl = result[0].path;
                        new ol.supermap.MapService(mapUrl).getMapInfo(function (mapInfo) {
                            layer = new ol.layer.Tile({
                                source: new ol.source.ImageSuperMapRest(ol.source.ImageSuperMapRest.optionsFromMapJSON(mapUrl, mapInfo.result))
                            });
                            map.addLayer(layer);
                        });
                    });
                }
            });
        });
Run effects
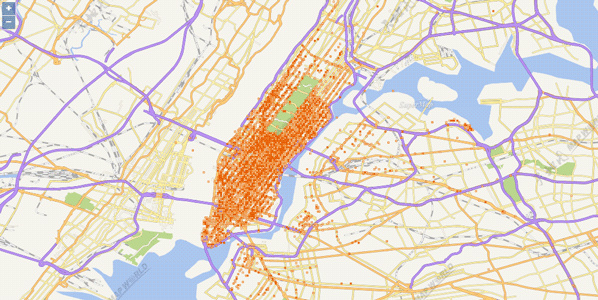
Sample: Single Object Query Analysis
Spatial query is a query method that selects map features based on their spatial relationships to other feature. For example, if you want to know the number of five-star hotels within 5 km of Olympic venues in Beijing, you can first make a 5 km buffer of the Olympic venues; search the hotels within these buffers using the Containing query method; then, from the result hotels, find the hotels whose star level is 5 using attribute query and the final result can be obtained.
The single object spatial query refers to spatial query with only one query object. If there are multiple objects in the query object dataset, the object with the smallest SmID will serve as the query object.
Here we perform a single object query analysis on the registered big data, where the spatial query mode is intersect.
Set singleObjectQueryJobsParam, including source dataset, query object dataset, spatial query mode.
                            //Single object query analysis parameters
var singleObjectQueryJobsParam = new SuperMap.SingleObjectQueryJobsParameter({
datasetName: 'ProcessingData_processing_newyorkZone_R', //Name of the registered dataset
datasetQuery: 'ProcessingData_processing_singleRegion_R', //Name of the dataset where the query objects are
mode:SpatialQueryMode //Spatial query mode
});
Submit the request for single object query analysis to the server, parse the results returned from the server, and display the results on the map.
                                    var processingService = new ol.supermap.ProcessingService(processingsUrl);
        processingService.addQueryJob(singleObjectQueryJobsParameter, function (serviceResult) {
            serviceResult.result.setting.serviceInfo.targetServiceInfos.map(function (info) {
                if (info.serviceType === 'RESTMAP') {
                    SuperMap.FetchRequest.get(info.serviceAddress + '/maps').then(function (response) {
                        return response.json();
                    }).then(function (result) {
                        var mapUrl = result[0].path;
                        new ol.supermap.MapService(mapUrl).getMapInfo(function (mapInfo) {
                            layer = new ol.layer.Tile({
                                source: new ol.source.ImageSuperMapRest(ol.source.ImageSuperMapRest.optionsFromMapJSON(mapUrl, mapInfo.result))
                            });
                            map.addLayer(layer);
                        });
                    });
                }
            });
        });
Run effects
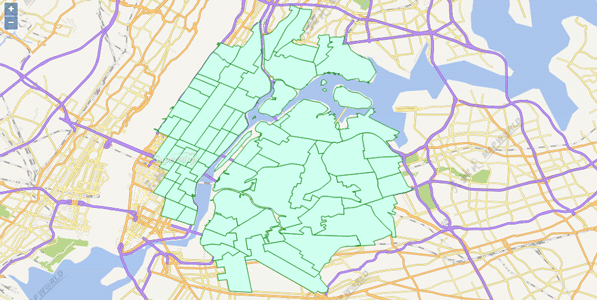
Sample: Region Summary Analysis
Region summary analysis refers to a spatial analysis for making aggregation maps for line and region datasets. The map lines and region features are divided according to grid surface or polygons, and then statistics will be done to the lines or regions in each grid cell according to standard attribute field or weight field. The statistical results will be regarded as the grid cell statistical values. Finally, the statistical values will be sorted and the grid cells will be rendered.
The concept of regional summary analysis is similar to that of point aggregation analysis. The difference is that point aggregation analysis does statistical calculation on point datasets, while the region summary analysis does statistical calculation for line and region datasets. For regional summary analysis, there are two statistical methods for the statistical values of grid cells: statistics based on standard attribute fields and weighted fields.
Here we perform a region summary analysis on the registered big data, where the region summary type is grid surface and the grid surface type is quadrilateral.
Set summaryRegionJobParam, including dataset, summary type, grid region summary type, etc.
                            //Region summary analysis parameters
var summaryRegionJobParam = new SuperMap.SummaryRegionJobParameter({
datasetName: 'ProcessingData_processing_newyorkZone_R', //Name of the registered dataset
    //regionDataset: 'regionDataset', Aggregation region dataset, used during polygon aggregation
    type: SummaryType, //Summary type, which can be grid surface summary and polygon summary
//Grid surface type, specify whether the grid unit is a quadrilateral grid or a hexagonal grid. 0 represents the former, and 1 represents the latter
    meshType:0,
    query: Bounds, //Analysis bounds
    standardSummaryFields: true, //Whether to do statistics based on standard attribute field
    //The statistical mode while doing statistics based on standard attribute field
    standardStatisticModes: StatisticAnalystMode,
    standardFields: "LocationID", //The field name when while doing statistics based on standard attribute field
    weightedFields:false, //Whether to do statistics based on weight field
    weightedStatisticModes: "", //The statistical mode while doing statistics based on weight field
weightedSummaryFields: "",//The field name while doing statistics based on weight field
//Grid size. For the quadrilateral, it is the grid length. For hexagonal meshes, it is the distance from the hexagonal vertex to the center point
    resolution:100,
    meshSizeUnit: Meter, //Grid size unit
    sumShape:true //Whether to do statistics on length or area
});
2. Submit the request for region summary analysis to the server, parse the results returned from the server, and display the results on the map.
                                    var processingService = new ol.supermap.ProcessingService(processingsUrl);
        processingService.addSummaryRegionJob(summaryRegionJobParameter, function (serviceResult) {
            serviceResult.result.setting.serviceInfo.targetServiceInfos.map(function (info) {
                if (info.serviceType === 'RESTMAP') {
                    SuperMap.FetchRequest.get(info.serviceAddress + '/maps').then(function (response) {
                        return response.json();
                    }).then(function (result) {
                        var mapUrl = result[0].path;
                        new ol.supermap.MapService(mapUrl).getMapInfo(function (mapInfo) {
                            layer = new ol.layer.Tile({
                                source: new ol.source.ImageSuperMapRest(ol.source.ImageSuperMapRest.optionsFromMapJSON(mapUrl, mapInfo.result))
                            });
                            map.addLayer(layer);
                        });
                    });
                }
            });
        });
Run effects
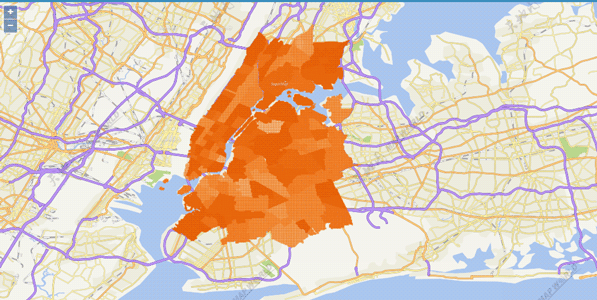
Sample: Vector Clip Analysis
Vector clip analysis is to clip the vector dataset, including internal clip and external clip. Internal clip maintains the portion within the clip area. External clip preserves the portion of dataset that is not within the clip area.
The vector clip analysis in distributed analysis service supports only one clip object. If there are multiple objects in the clip object dataset, the object with the smallest SmID will serve as the clip object.
Here we perform a vector clip analysis on the registered big data, employing the internal clip mode.
Set vectorClipJobsParam, including source data, clip object, clip object dataset, clip analysis mode.
                            //Vector clip analysis parameters
var vectorClipJobsParam = new SuperMap.VectorClipJobsParameter({
datasetName: 'ProcessingData_newyork_taxi_2013-01_14k', //Name of the registered dataset
    datasetOverlay: 'ProcessingData_processing_singleRegion_R',//Name of the dataset where the clip object is
    mode:ClipAnalystMode //Clip analysis mode
});
Submit the request for vector clip analysis to the server, parse the results returned from the server, and display the results on the map.
                                    var processingService = new ol.supermap.ProcessingService(processingsUrl);
        processingService.addVectorClipJob(vectorClipJobsParameter, function (serviceResult) {
            serviceResult.result.setting.serviceInfo.targetServiceInfos.map(function (info) {
                if (info.serviceType === 'RESTMAP') {
                    SuperMap.FetchRequest.get(info.serviceAddress + '/maps').then(function (response) {
                        return response.json();
                    }).then(function (result) {
                        var mapUrl = result[0].path;
                        new ol.supermap.MapService(mapUrl).getMapInfo(function (mapInfo) {
                            layer = new ol.layer.Tile({
                                source: new ol.source.ImageSuperMapRest(ol.source.ImageSuperMapRest.optionsFromMapJSON(mapUrl, mapInfo.result))
                            });
                            map.addLayer(layer);
                        });
                    });
                }
            });
        });
Run effects
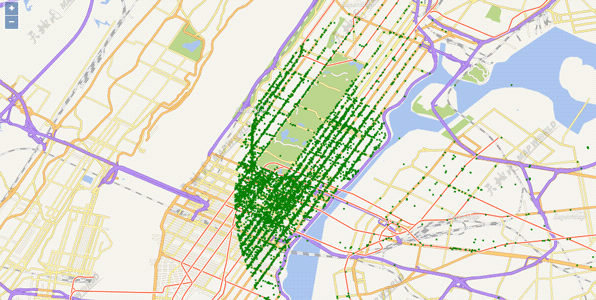
Using Data Stream Services
                            var container = document.getElementById('popup');
    var content = document.getElementById('popup-content');
    var overlay = new ol.Overlay(({
        element: container,
        autoPan: true,
        autoPanAnimation: {
            duration: 250
        }
    }));
    var map, resultLayer,
            urlMap = "https://iserver.supermap.io/iserver/services/map-china400/rest/maps/China",
            urlQuery = "https://iserver.supermap.io/iserver/services/map-china400/rest/maps/China_4326",
            urlDataFlow = "ws://117.122.248.69:8091/iserver/services/dataflow/dataflow";
    var timer, featureResult, dataFlowService, source;
    new ol.supermap.MapService(urlQuery).getMapInfo(function (serviceResult) {
        var mapJSONObj = serviceResult.result;
        var map = new ol.Map({
            target: 'map',
            controls: ol.control.defaults({attributionOptions: {collapsed: false}})
                .extend([new ol.supermap.control.Logo()]),
            view: new ol.View({
                center: [116.443571, 39.887549],
                zoom: 12,
                projection: 'EPSG:4326'
            }),
            overlays: [overlay]
        });
        var layer = new ol.layer.Tile({
            source: new ol.source.TileSuperMapRest(ol.source.TileSuperMapRest.optionsFromMapJSON(urlQuery, mapJSONObj))
        });
        map.addLayer(layer);
        query();
        function query() {
            var param = new SuperMap.QueryBySQLParameters({
                queryParams: {
                    name: "Main_Road_L@China#1",
                    attributeFilter: "SMID = 1755"
                }
            });
            var fill = new ol.style.Fill({
                color: 'rgba(255,0,0,0.9)'
            });
            var stroke = new ol.style.Stroke({
                color: '#3399CC',
                width: 1.25
            });
            var styles = [
                new ol.style.Style({
                    image: new ol.style.Circle({
                        fill: fill,
                        radius: 5
                    }),
                    fill: fill,
                })
            ];
            new ol.supermap.QueryService(urlQuery)
                    .queryBySQL(param, function (serviceResult) {
                        featureResult = serviceResult;
                        source = new ol.source.DataFlow({ws: urlDataFlow});
                        source.on('addfeature',function (e) {
                            var feature=e.feature;
                            content.innerHTML = feature.get('time');
                            overlay.setPosition(feature.getGeometry().getCoordinates());
                        });
                        resultLayer = new ol.layer.Vector({
                            source: source,
                            style:new ol.style.Style({
                                image: new ol.style.Circle({
                                    fill: fill,
                                    radius: 6
                                }),
                                fill: fill,
                            })
                        });
                        source.on('subscribeSuccessed', function (e) {
                            dataFlowService = new ol.supermap.DataFlowService(urlDataFlow).initBroadcast();
                            dataFlowService.on('broadcastSocketConnected', function (e) {
                                timer = window.setInterval("broadcast()", 2000);
                            })
                        })
                        map.addLayer(resultLayer);
                    });


        }
    });
    var count = 200;
    function broadcast() {
        if (count >= featureResult.result.recordsets[0].features.features[0].geometry.coordinates.length) {
            window.clearInterval(timer);
            return;
        }
        var point = featureResult.result.recordsets[0].features.features[0].geometry.coordinates[count];
        var feature = {
            geometry: {coordinates: [point[0], point[1]], type: "Point"},
            type: "Feature",
            properties: {id: 1, time: new Date()}
        };
        dataFlowService.broadcast(feature);
        count += 3;
    }
The following graph shows the effects of real-time data at different times, and you can see that the data is displayed in different locations.
Run effects
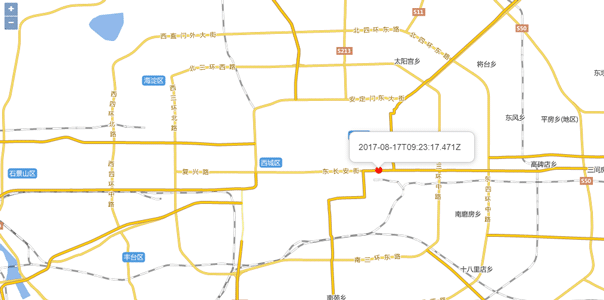
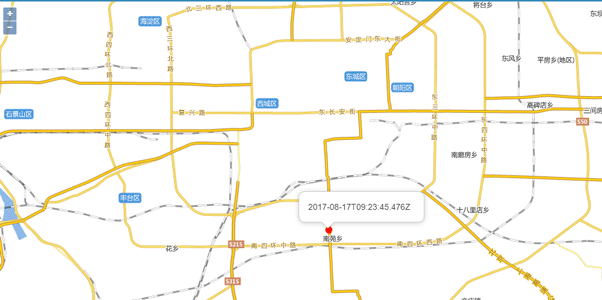
Using Address Matching Services
SuperMap iClient for OpenLayers supports address matching service, which includes forward address matching and reverse address matching. Users can find the location using address, and they can also get the address of a location on the map.
Here we introduce how to perform address matching using China_4326.
Sample: Forward Address Matching
Forward address matching obtains geographic coordinates and structured and detailed address description based on address description, city bounds.
                            //Forward matching parameters
var geoCodeParam = new SuperMap.GeoCodingParameter({
	address: "SuperMap", //Address
    fromIndex:0, //Min index
    toIndex:10, //Max index
    filters: "Company", //Filter condition
    prjCoordSys:{epsgcode26}, //Set coordinates
    maxReturn:3 //Max results
});
//Createm address matching service
var addressUrl = "https://iserver.supermap.io/iserver/services/addressmatch-Address/restjsr/v1/address",
    addressMatchService = new ol.supermap.AddressMatchService(addressUrl);
//Send request to the server to operate forward address matching. The server will return the results and the results will be handled
addressMatchService.code(geoCodeParam, match);
function match(obj) {
        var vectorSource = new ol.source.Vector();
        var features = [];
        obj.result.map(function (item) {
            var feature = new ol.Feature();
            feature.setGeometry(new ol.geom.Point([item.location.x, item.location.y]));
            feature.setProperties({
                location: item.location,
                address: item.address,
                score: item.score,
                filters: item.filters
            });
            feature.setStyle(new ol.style.Style({
                image: new ol.style.Icon(({
                    anchor: [0.5, 1],
                    src: imgUrl
                }))
            }));
            features.push(feature);
        });
        vectorSource.addFeatures(features);
}
Run effects
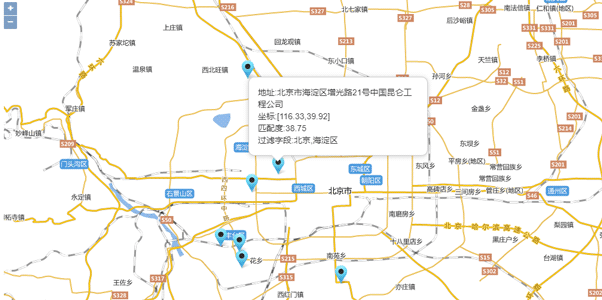
Sample: Reverse Address Matching
Get the corresponding address description according to reverse address matching based on input address coordinates
                            //Reverse matching parameters
var geoDecodeParam = new SuperMap.GeoDecodingParameter({
x:116.3518541194, //X coordinate
y:40.00097839595, //Y coordinate
    fromIndex:0, //Min index
    toIndex:10, //Max index
    filters: "", //Filter field
    prjCoordSys:{epsgcode26}, //Set coordinates
    maxReturn:3, //Max results
geoDecodingRadius:1000 //Search radius
});
//Create address matching service
var addressUrl = "https://iserver.supermap.io/iserver/services/addressmatch-Address/restjsr/v1/address",
    addressMatchService = new ol.supermap.AddressMatchService(addressUrl);
//Send request to the server to operate forward address matching. The server will return the results and the results will be handled
addressMatchService.code(geoCodeParam, match);
function match(obj) {
        var vectorSource = new ol.source.Vector();
        var features = [];
        obj.result.map(function (item) {
            var feature = new ol.Feature();
            feature.setGeometry(new ol.geom.Point([item.location.x, item.location.y]));
            feature.setProperties({
                location: item.location,
                address: item.address,
                score: item.score,
                filters: item.filters
            });
            feature.setStyle(new ol.style.Style({
                image: new ol.style.Icon(({
                    anchor: [0.5, 1],
                    src: imgUrl
                }))
            }));
            features.push(feature);
        });
        vectorSource.addFeatures(features);
}
Run effects