SuperMap iClient JavaScript 11i(2022) - a cloud GIS web client development platform
Based on the brand new Web technology, it is the unified JavaScript client of SuperMap
cloud
GIS and online GIS platform products.
It integrates the leading open source map and
visualization libraries, and the core code is fully open source with the Apache License
2.0
protocol, connecting SuperMap with the open source community. It provides features of
big
data visualization, data flow visualization, and achieves professional and smooth
display
and spatial analysis both in browsers and on mobile devices.
SuperMap iClient JavaScript 11i(2022)
-a cloud GIS web client development
platform
Based on the brand new Web technology, it is the unified JavaScript client of SuperMap cloud GIS and online GIS platform products. It integrates the leading open source map and visualization libraries, and the core code is fully open source with the Apache License 2.0 protocol, connecting SuperMap with the open source community. It provides features of big data visualization, data flow visualization, and achieves professional and smooth display and spatial analysis both in browsers and on mobile devices.
iClient for Leaflet
GIS Client Application Development Tool based on Leaflet
 Introduction
 Developer Guide
 API
API
iClient for OpenLayers
GIS Client Application Development Tool based on OpenLayers
iClient for MapboxGL
GIS Client Application Development Tool based on MapboxGL v1
iClient for Classic
GIS Client Application Development Tool based on SuperMap iClient 8C

iClient 3D-WebGL
GIS Client Development Tool based on Cesium and oriented at HTML5
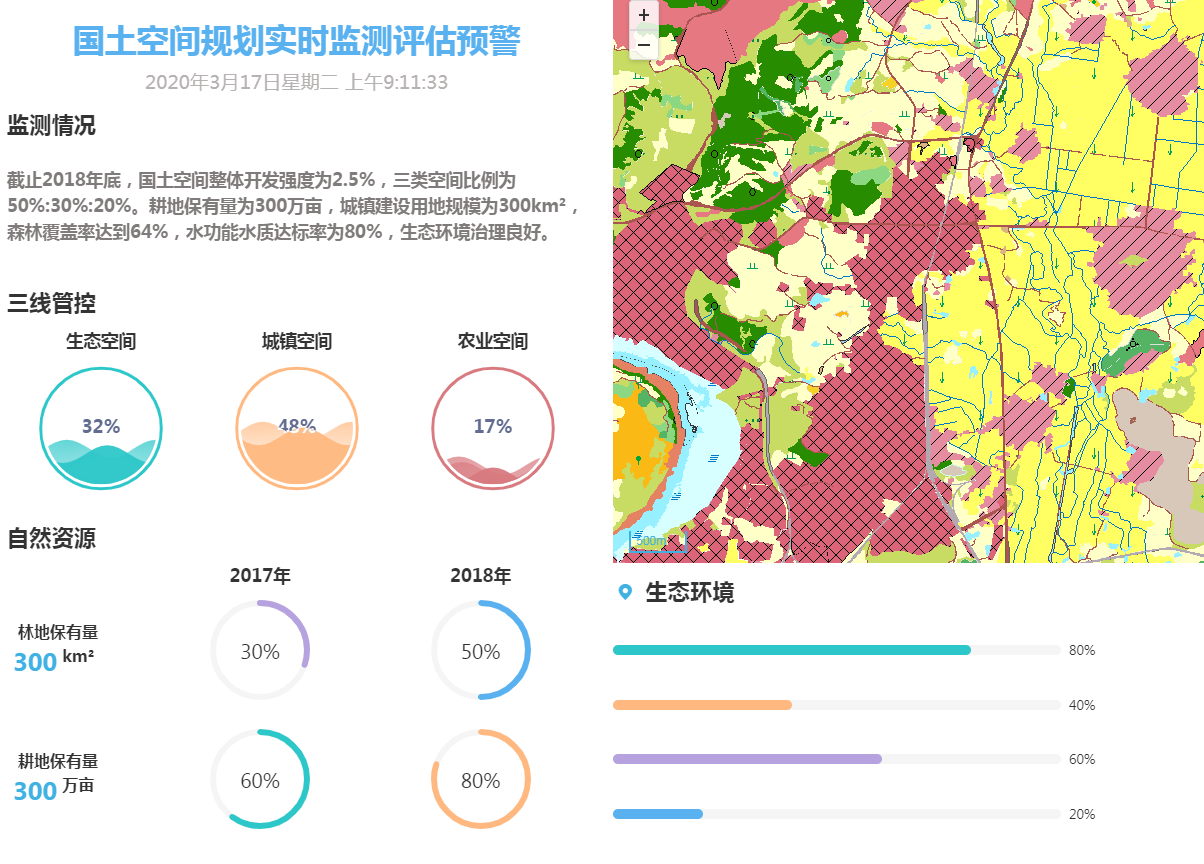

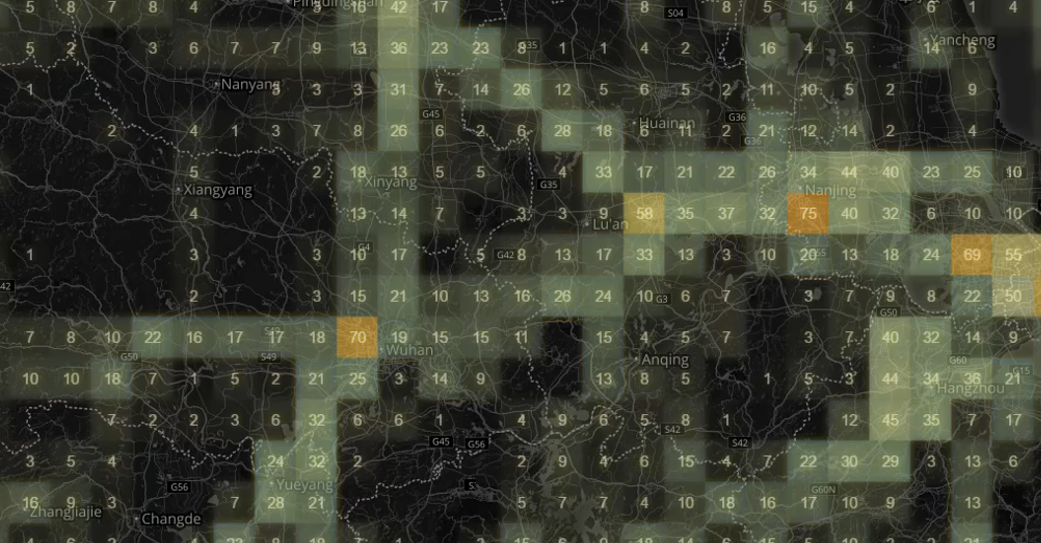
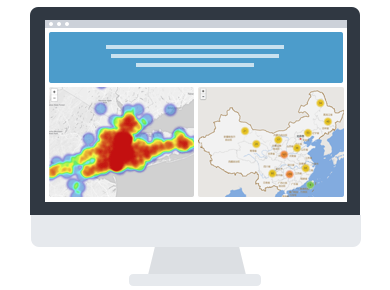
Distributed Analysis Visualization
Support visualization of big data analysis results of SuperMap iServer
 Examples
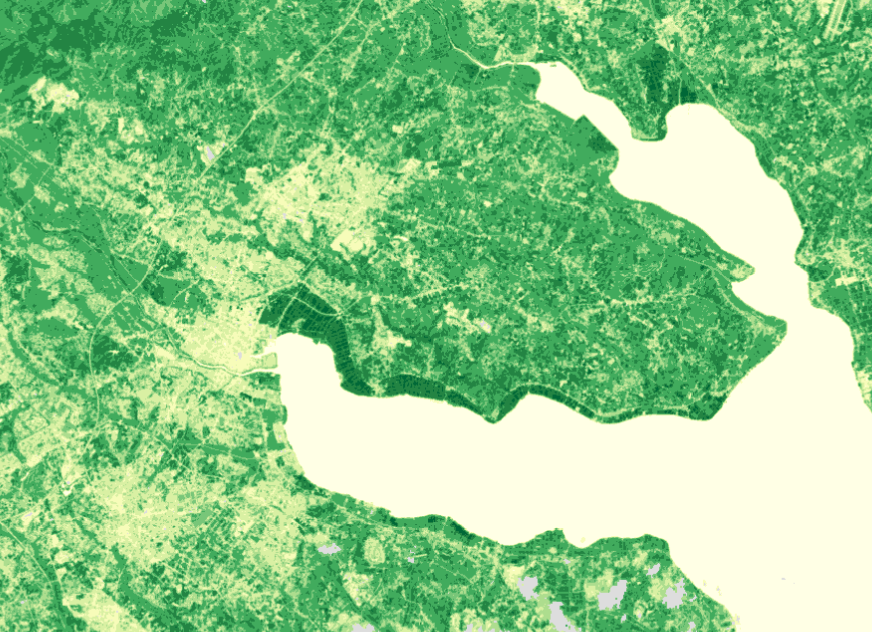
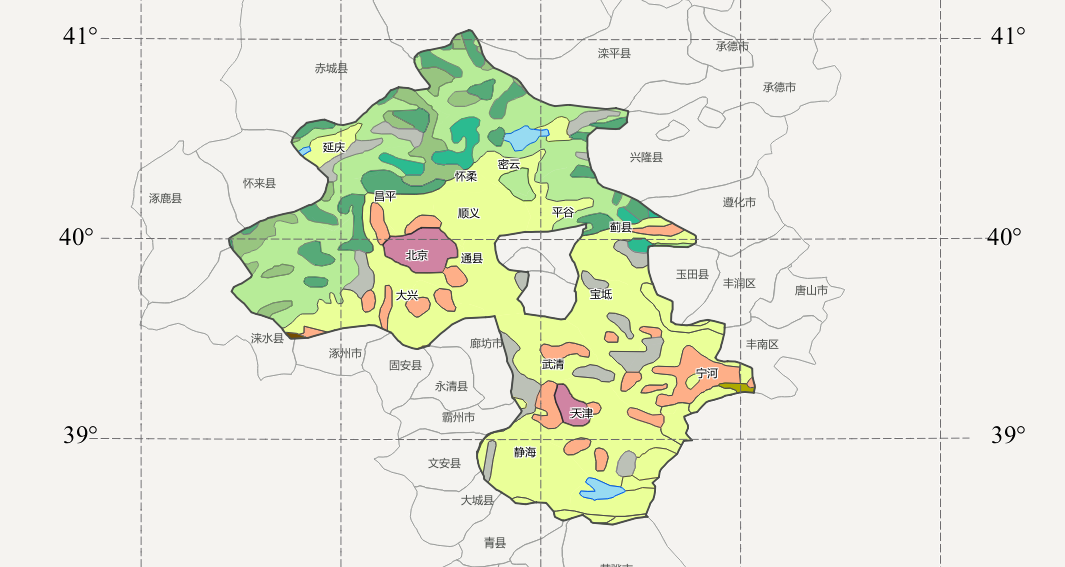
Regional summary distributed analysis example
Realtime Data Visualization
Support real-time data service visualization of SuperMap iServer
Examples
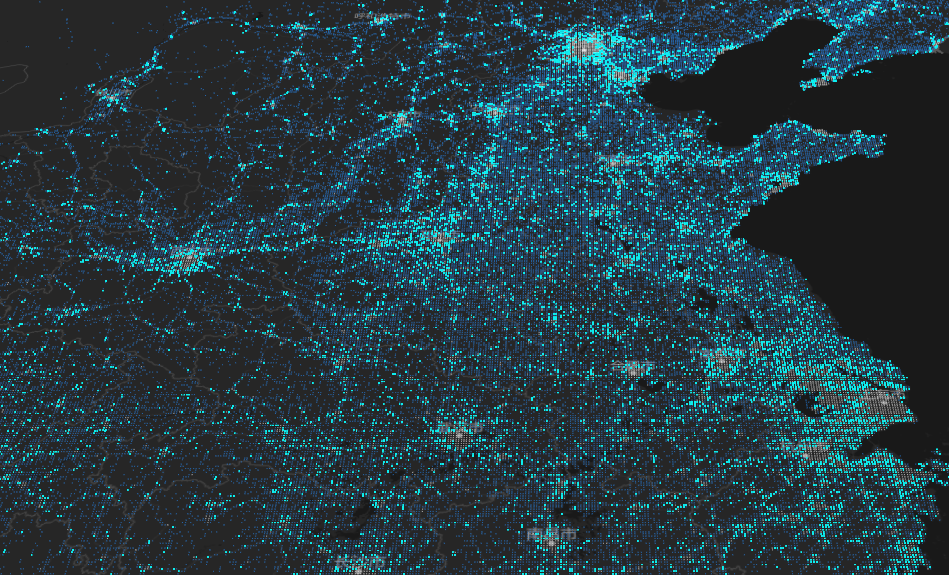
10,000+ real-time location visualization example
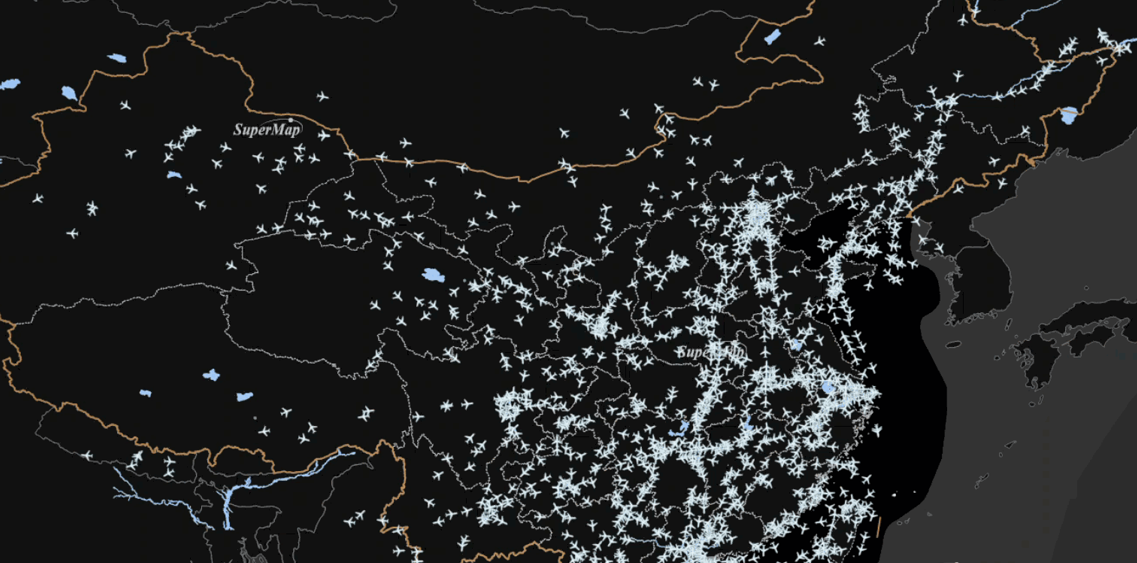
Sequential Data Visualization
Supports visualization of time series data stored in Elasticsearch
Examples
8 million historical flight data visualization example
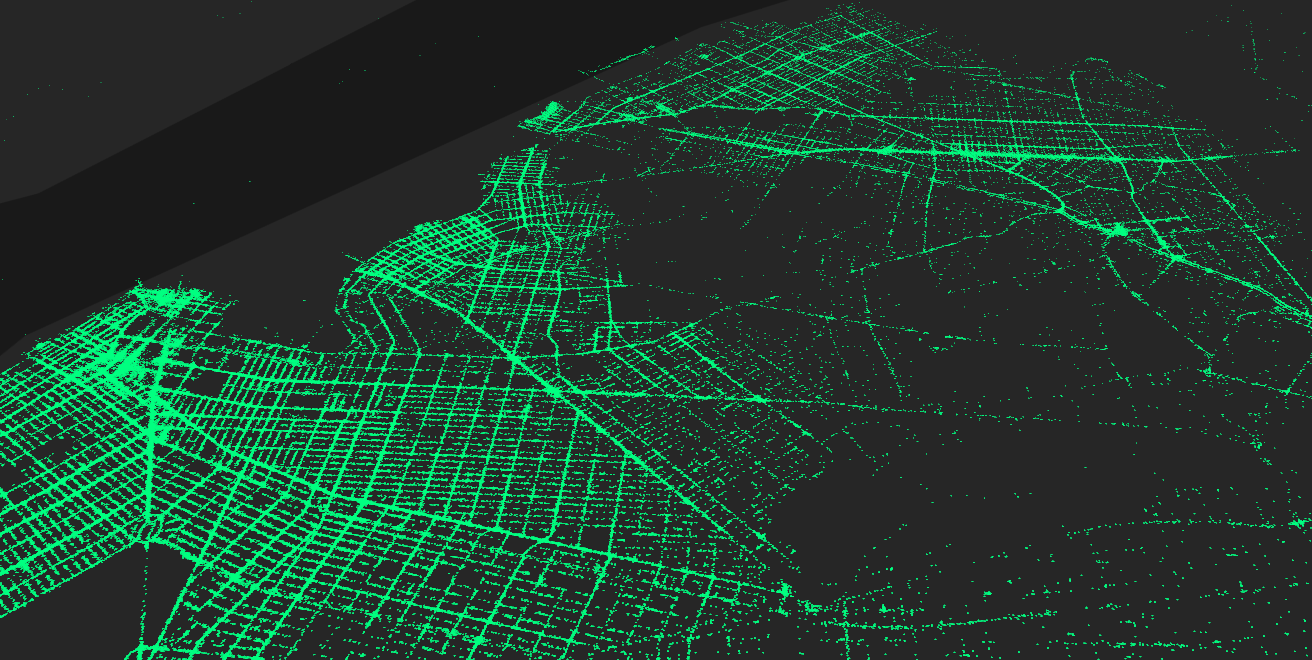
High Efficiency Point Layer
Support millions of location data visualization
Examples
Visualization example of 1.45 million New York taxi pick-up points
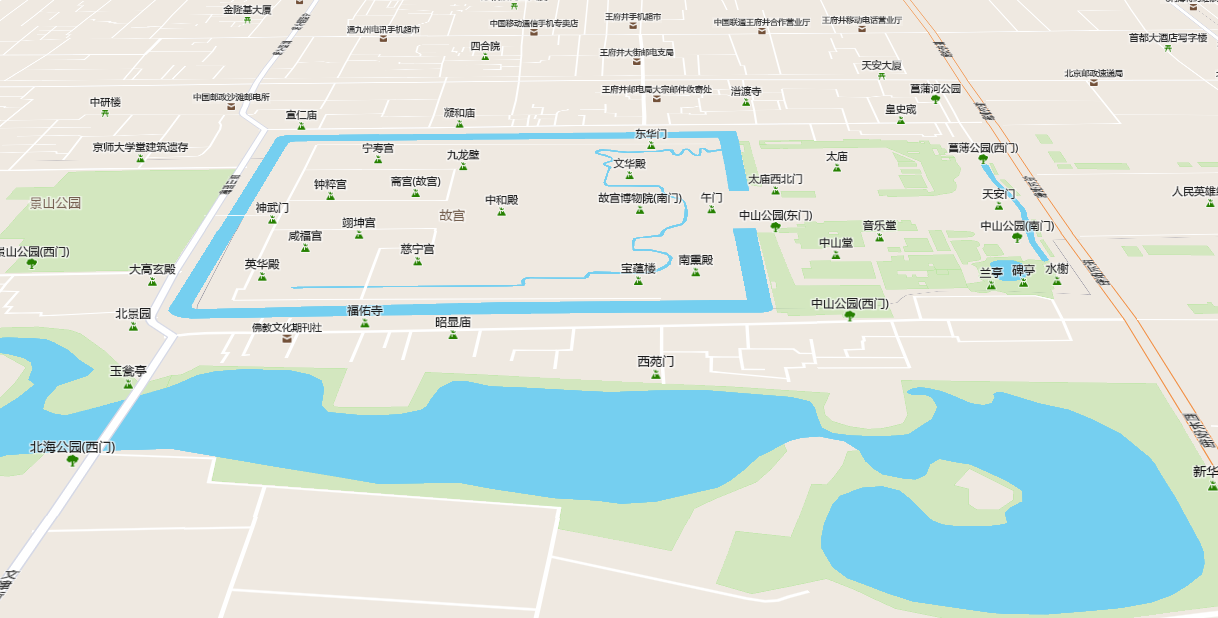
Vector tiles
Support Mapbox Vector Tile (MVT) vector tile specification
Examples
Vector tile style dynamic switching example
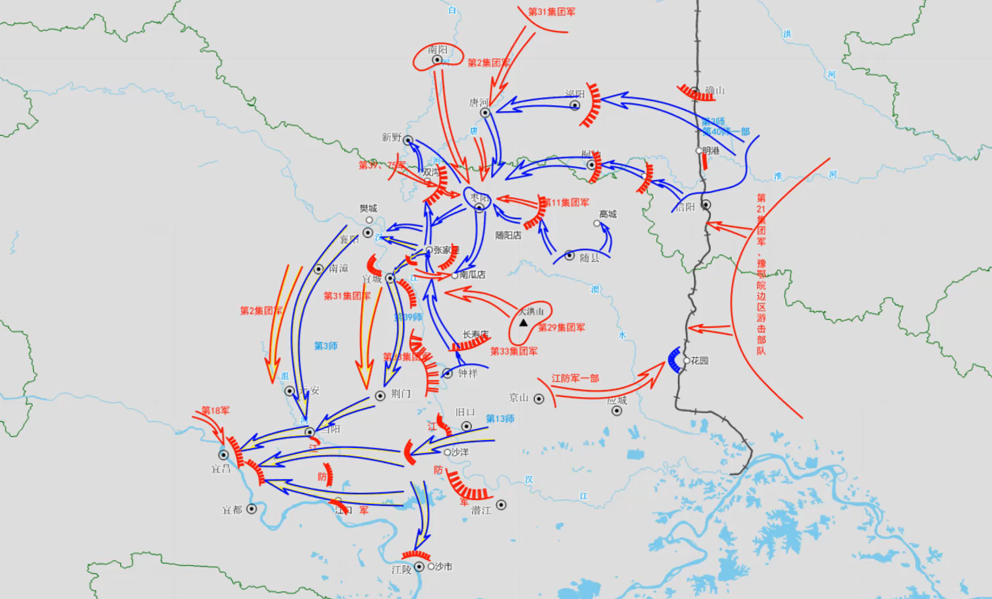
Two Dimensional Dynamic Plotting
Intuitive and flexible dynamic plotting, support 7 classic animation situation deduction
Examples
Dynamic plotting example
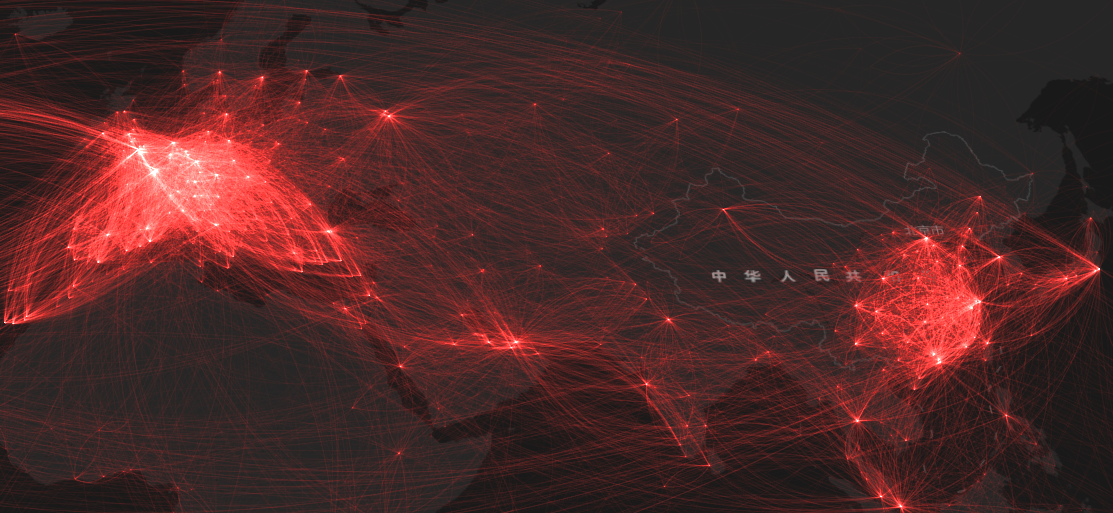
ECharts
Support ECharts chart and geographic visualization capabilities
Examples
Example World Airline Route Map

EChartsGL
Support EChartsGL's geographic visualization capabilities
Examples
Example of Cape Town taxi road map

MapV
Support MapV's geographic visualization capabilities
Examples
Example of simulated migration dynamic OD diagram

DeckGL
Support Uber Deck.GL's geographic visualization capabilities
Examples
San Francisco contour map example
Modern WebGIS
Completely rebuilt based on H5, WebGL, WebSocket, ES6, RequireJS, npm and other modern web technologies. Supports componentized frameworks Vue, React and native H5 development.

Easier to Use
Unify service access and security authentication interfaces of SuperMap iServer, iEdge, iPortal, iManager, Online services to provide users with a simpler and more easy-to-use API and more features
WHAT'S NEW
Fix several bugs, details
Fix several bugs, details
-
Added WebMap components, chart components, legend components, layer list components, measurement components, query/search components, progress bars and other basic components, support multiple themes (one-click switch style) Details >
-
Support WGS84, China2000, Xian80, Beijing54 and other standard geographic coordinate systems, covering MVT vector tiles, grid tiles, visual layers, plotting and other functions
Need to reference iClient’s enhanced library for Mapbox GL JS (based on October 2018 v0.51.0) Details > -
Added open file component, data flow component, address match and features search component, client computation component, distribute analysis component, data service query component Details >
Integrate with Turf.js, providing users with calculation ability at the client side such as spatial analysis, topology analysis, equivalent analysis, measure analysis and so on. This makes it possible for a variety of common spatial operations to be done quickly at the client side without connecting GIS services
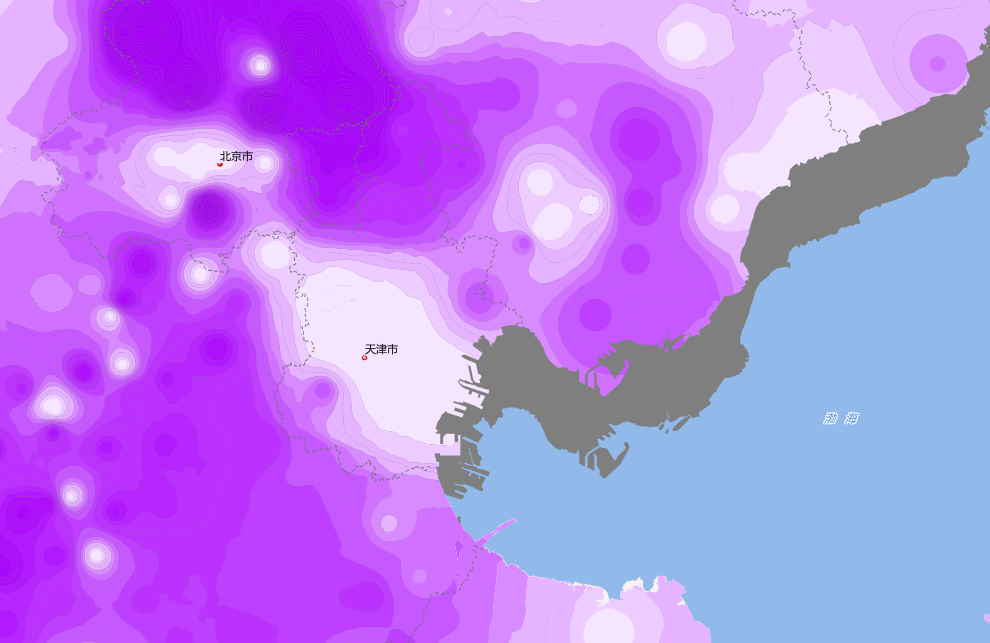
Integrate with 3D thematic map, global wind map and more visualization effects of ECharts / ECharts GL / D3.js libraries, continuing to strengthen the cool visual effects based on the version 9D.
Modularized the code, supporting modularized reference by using import grammar in JavaScript ES6 standard during the development
Release the npm project. The url is:https://www.npmjs.com/~supermap
Release the English version. The product introduction, example, APIDoc and other pages of the official website support both Chinese and English
Optimizations of official website: support of multiple versions(9.0.0/9.0.1/dev), easier navigation, more optimized waiting style and popup style of examples, etc.
Complete the infrastructure reconstruction; open source + open; fully integrated with other commonly used map libraries and charting libraries such as Leaflet, OpenLayers, Mapbox GL JS, ECharts, MapV to avoid the user's repetitive learning and cost input
Support access to SuperMap iServer distributed analysis Services, providing density analysis, grid aggregation analysis, single object query analysis, region summary analysis, vector clipping analysis, buffers, topology validator, overlay geo, summary attributes functions
Support access to address matching services of SuperMap iServer, providing forward matching and reverse matching functions
Support access to SuperMap iServer real time data services
New visual effects of time series heat map and flight monitoring effects based on ElasticSearch
Support Mapbox Vector Tile standard, providing users with more map styles to freely change styles at the client side
Add high efficiency point layer, supporting efficient and fluent rendering of 100,000+ point elements in the browser
Integrate with commonly used ECharts visualization effects: scatter map, migration map, heat map, line map, line effects, polyline chart, histogram, pie chart
Integrate with data visualization Open Source Library MapV, providing the honeycomb map, commuting map, strong boundary map, migration map, dynamic trajectory map, the polygon drawing, line drawing and massive point data drawing functions
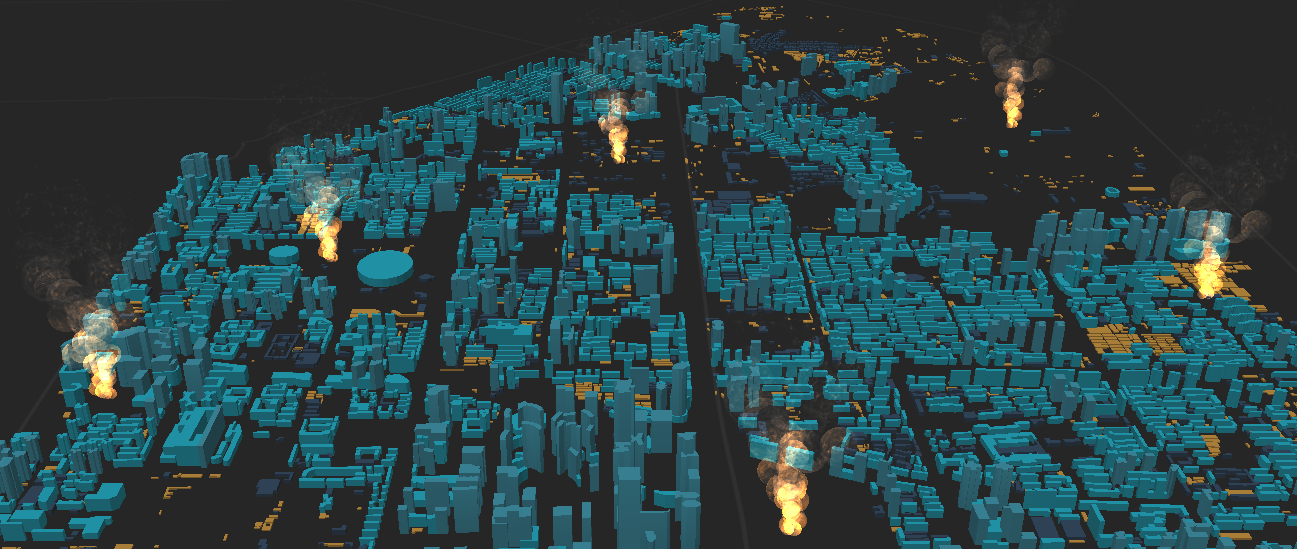
Integrate with OSMBuildings to implement visualization of building stereo effects
New cache switch control to allow users to switch among different versions of cache on clients
Easier access to maps configured in SuperMap iPortal and SuperMap Online by users
Unify the secure authentication interfaces of SuperMap iServer, SuperMap iPortal, SuperMap Online. Support for secure login and access to services or maps with token or Key
Completely new site: iclient.supermapol.com. Easier sample demonstration