
 Download
iClient
Download
iClient
 source
code
source
code
SuperMap iClient JavaScript 10i is a cloud GIS web client development platform. Based on the brand new Web technology, it is the unified JavaScript client of SuperMap cloud GIS and online GIS platform products. It integrates the leading open source map and visualization libraries, and the core code is fully open source with the Apache License 2.0 protocol, connecting SuperMap with the open source community. It provides features of big data visualization, data flow visualization, and achieves professional and smooth display and spatial analysis both in browsers and on mobile devices.
Excellent practices for open source products
Fully integrates map libraries and chart libraries such as Leaflet, OpenLayers, Mapbox GL JS, ECharts, MapV, DECK.GL etc., avoiding repetitive learning and cost input

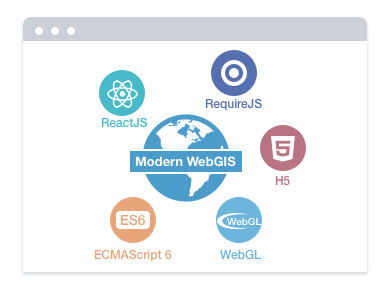
Modern WebGIS
Completely rebuilt based on H5, WebGL, WebSocket, ES6, RequireJS, npm and other modern web technologies
Open architecture,Open source kernel
SuperMap iClient JavaScript 10i core source code is released based on Apache License 2.0 Open Source License Agreement and it can be downloaded and distributed from GitHub, OSChina

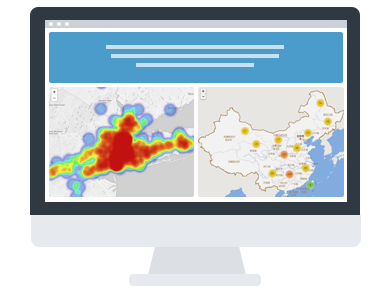
Big Data Visualization
Provides unified API and visualization for distributed analysis services, data flow services, etc. of SuperMap iServer. And supports heat map, honeycomb map, grid map, scatter map, vector tiles and other visual rendering methods for big data
Easier to Use
Unify service access and security authentication interfaces of SuperMap iServer, iEdge, iPortal, iManager, Online services to provide users with a simpler and more easy-to-use API and more features

Libraries
WHAT'S NEW
The architecture design of the SuperMap iClient UI Components adopt The MVVM (Model-View-ViewModel)patter
It also compatible with other frameworks like React, Angular, and native H5 development
Using the library, you can build custom WebGIS applications as quickly as building blocks
The component library uses an unpacking-available solution
At this stage, it provides two/three-dimensional map components, rich geographic visualization components, chart class components and basic GIS components
In terms of theme style, the SuperMap iClient UI Components has multiple sets of themes built in the current stage, you can switch the theme style of all components with one click.
Added WebMap components, chart components, legend components, layer list components, measurement components, query/search components, progress bars and other basic components, support multiple themes (one-click switch style)
Support WGS84, China2000, Xian80, Beijing54 and other standard
geographic coordinate systems, covering MVT vector tiles, grid
tiles, visual layers, plotting and other functions
Need to reference iClient’s enhanced library for Mapbox GL JS (based
on October 2018 v0.51.0)
Added open file component, data flow component, address match and features search component, client computation component, distribute analysis component, data service query component
GraphicLayer supports data volume increased from 300,000 to 1
million
The performance is improved to more than 3 times, the rendering of
million-point data is able to be completed within 1 second
Supports multiple data formats such as GeoJSON, TopoJSON, and
two-dimensional tables, etc
Supports style changes; supports interactive operation, such as
property filtering and mouse events, etc.
DataFlowLayer added MapV engine, the performance of drawing Marker
is greatly improved
The amount of vector point rendering data increased from 10,000 to
100,000, and the raster image rendering data increased from 3000 to
10,000.
Docked the latest ECharts 4.1.0, added increment rendering capabilities, supports visual rendering of data at ten millions of data level.
Support for Mapbox Vector Tile (MVT) open standards based on Mapbox
GL JS, OpenLayers, etc.
Interactive, online editable map style and changing styles do not
require anti-copying and re-slices
Support Web Mercator, WGS84, China2000,etc.
Added more effects and examples of DECK.GL, ECharts, ECharts GL.
Flexible and convenient 2D dynamic plotting based on Leaflet
gallery
Situational derivation with 7 classic animations
Provide convenient situation map management
Optimized API documentation
Organized document content, optimized document display format,
improved interface parameters and their usage descriptions
Greatly improved document readability and usability
Integrate with Turf.js, providing users with calculation ability at the client side such as spatial analysis, topology analysis, equivalent analysis, measure analysis and so on. This makes it possible for a variety of common spatial operations to be done quickly at the client side without connecting GIS services
Integrate with 3D thematic map, global wind map and more visualization effects of ECharts / ECharts GL / D3.js libraries, continuing to strengthen the cool visual effects based on the version 9D.
Modularized the code, supporting modularized reference by using import grammar in JavaScript ES6 standard during the development
Release the npm project. The url is: https://www.npmjs.com/~supermap
Release the English version. The product introduction, example, APIDoc and other pages of the official website support both Chinese and English
Optimizations of official website: support of multiple versions(9.0.0/9.0.1/dev), easier navigation, more optimized waiting style and popup style of examples, etc.
Complete the infrastructure reconstruction; open source + open; fully integrated with other commonly used map libraries and charting libraries such as Leaflet, OpenLayers, Mapbox GL JS, ECharts, MapV to avoid the user's repetitive learning and cost input
Support access to SuperMap iServer distributed analysis Services, providing density analysis, grid aggregation analysis, single object query analysis, region summary analysis, vector clipping analysis, buffers, topology validator, overlay geo, summary attributes functions
Support access to address matching services of SuperMap iServer, providing forward matching and reverse matching functions
Support access to SuperMap iServer real time data services
New visual effects of time series heat map and flight monitoring effects based on ElasticSearch
Support Mapbox Vector Tile standard, providing users with more map styles to freely change styles at the client side
Add high efficiency point layer, supporting efficient and fluent rendering of 100,000+ point elements in the browser
Integrate with commonly used ECharts visualization effects: scatter map, migration map, heat map, line map, line effects, polyline chart, histogram, pie chart
Integrate with data visualization Open Source Library MapV, providing the honeycomb map, commuting map, strong boundary map, migration map, dynamic trajectory map, the polygon drawing, line drawing and massive point data drawing functions
Integrate with OSMBuildings to implement visualization of building stereo effects
New cache switch control to allow users to switch among different versions of cache on clients
Easier access to maps configured in SuperMap iPortal and SuperMap Online by users
Unify the secure authentication interfaces of SuperMap iServer, SuperMap iPortal, SuperMap Online. Support for secure login and access to services or maps with token or Key
Completely new site: iclient.supermap.io. Easier sample demonstration